We can make even the junior high school students! Handmade easy by our personal things!
EXPLANATION・THEORY
Energy commentary
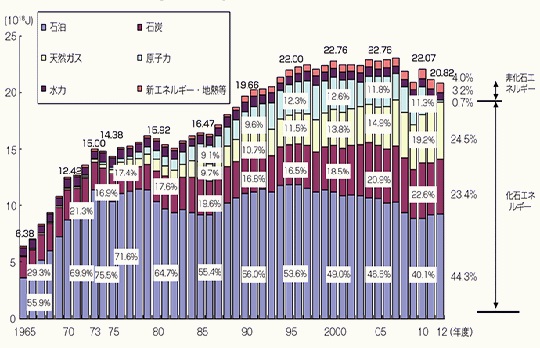
About domestic supply of the energy
From the left figure,the energy production in Japan is a tendency to decrease in the peak in 2008. 2011,the reason why it decreased with 2012 is that the operation of nuclear power plants of all Japan stopped nder the influence of an accident of Fukusima first Nuclear Power Plant by East Japan great earthquake disaster.Thermal power generation using coal,natural gas increases when we look by energy distinction.The amount of production by new energy such as the wind-generated electricity gradully increases,too.( The source : Energy White Paper 2014 P.143 www.enecho.meti.go.jp )
( A graph is clicked, and expands. )
About wind-generated electricity introduction of Japan
In Japan, introduction of the wind-generated electricity advances. Qantity and number of the total setting of the wind-power plant,total facilities increases together. In late years some force weakens, but movement to propel after 3.11,new energy generation is seen. Therefore increase in wind-generated electricity is anticipated in future.( A graph is clicked, and expands. )
The energy commentary (In the world)
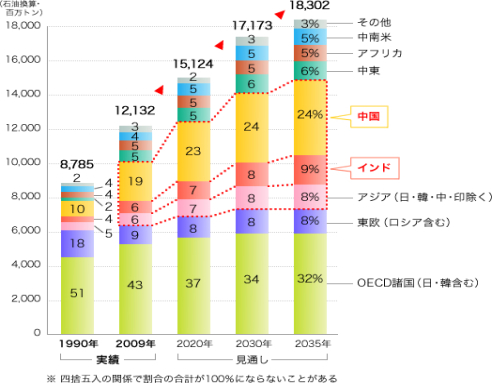
About an energy consumption
From the left figure, we understand that world consumptions increase as a year passes. In addition,the increase in developing countries of Asia is outstanding mainly. The world energy consumption is expected to double 1.5 from 2010 through 2035.
(The source : Hokuriku Electric Power Co. www.rikuden.co.jp )
Windmill theory
Energy of the wind
 Velocity of the wind power is P[W]、mass M[kg]、wind velocity V[m/s]、Air
density ρ[kg/m3]、Receive ,area of a wind A[m2]. the next come to it-type.
Velocity of the wind power is P[W]、mass M[kg]、wind velocity V[m/s]、Air
density ρ[kg/m3]、Receive ,area of a wind A[m2]. the next come to it-type.P=1/2V2=1/2(PAV)V2=1/2PAV3
By the law of Betz, the power coefficient to be able to take out of wind is to16/27.(Betz's coefficient) To 0.593 of the power that the wind has, I can take it out theoretically.It may be said that the generation output performance of the windmill is high so that a value of CP becomes big.
We understand that the generation efficiency of the windmill is proportional to Area and cube of the wind velocity from an upper calculating formula.
Reynolds number

Viscous power in the viscous fluid flow refers to the ratio of the inertial
force. therefore,by the flow that Reynolds number is small, a viscous decrement
effect is big.So the flow is stable and,on the contrary,the flow that Reynolds
number has a big is generally unstable and is more likely to be turbulent
flow.
Re= inertial force÷viscous force
Re=UL÷ν
U:The speed of the flow [m/s]
L :The representative length of the object which there is in a flow [m]
ν : Kinematic viscosity =μ(Coefficient of viscosity)÷ρ(Density)
μ:Viscosity[Pa・s]
ρ :Density[kg/m3]
Critical Reynolds number Re=2320 Between Laminar flow and turbulent flow
It is called Re= 2000〜4000 that laminar flow changes to turbulent flow dring this period in a transition region.
Resemblance rule of Reynolds
Size is diffrent from the blade of miniature by the wind tunnel experiment in the real windmill.You must make Reynolds number agree.
The blade of the miniature is 5cm, and, in the case of 25cm, the wind velocity of the model must double5 the blade of the real windmill.
However,if there is not viscous influence, I ignore it.Because,it is very difficult to double the wind velocity 5.
Lamina flow and turbulent flow
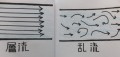
The direction of the flow calls the same flow laminar flow, and turbulent
flow means irregular flow.In the wind tunnel, I make the flow of laminar
flow and watch flow of the air around the wing.
The principle that a windmill surrounds
 The operation of the windmill has a drag type and a lift type. Methods
to change wind energy into rotatory power each are different. In this study,
We make a lift type windmill. (The representative of the drag type is a
savonius type windmill.)
The operation of the windmill has a drag type and a lift type. Methods
to change wind energy into rotatory power each are different. In this study,
We make a lift type windmill. (The representative of the drag type is a
savonius type windmill.)The wing gets ascending lift as reaction from a fluid like an upper figure.
Exfoloation
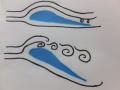
It is that a flow along the object surface comes off in the down stream
side and is confused.Drag becomes small if they suppress this detachment,
and wings turn around well.
Wing of the doragonfly
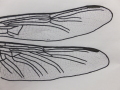
We thuoght that the blade which there was an effect in was necessary for
low Reynolds number to turn arond by a soft breeze well.A flow of the air
is done in unevenness, and the characteristic of the dragonfly's wing moves
a blad and neighboring air and does not make stagnation area of the air.e
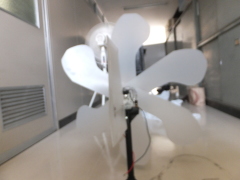
In this experiment, we took the theory of the microeko-windmill of Nippon Bunri University into account. Furthermore, we made 6pieces of original blades which we added dimple to.
Dimple( Relations turbulent flow and exfoloation )
A golf ball has a dimple.
As for the soft and smoothball, the state of the surface boundary layer is laminar flow. However, the dimple ball is turbulent flow. And separation point retreats tobe behind with the detachment of the current of air than the trbulent layer. As a result, as for little turbulence strata of the disorder domain, air resistance becomes ledd than the laminar flow stratum, and a flying distance increases. Therefore air resistance decreases, and nmber of revolutions of the ball which we added a dimple to increases, and it is thought that output electricity increases.
Wind-lens turbine
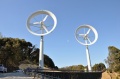
A brimmed diffuser windmill is a wind lenswith "brim" which can
expect the high output by the weak wind. The popular name "Wind lens
turbine" was developed in Kyushu University.
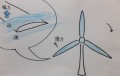
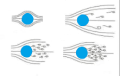
Structure of wind-lens turbine
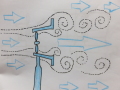 "A vortex" occurs to" the wind lens turbine" rear by
attaching diffuser and the brim. By "a vortex", the pressure
of the center decreases,and wind to flow indiffuser increases. Therefore
even slow wind seems to come to be able to generate electricity.
"A vortex" occurs to" the wind lens turbine" rear by
attaching diffuser and the brim. By "a vortex", the pressure
of the center decreases,and wind to flow indiffuser increases. Therefore
even slow wind seems to come to be able to generate electricity.Retern to Top
バナースペース
We take part in the All Japan Secondary School and High School Web Contest
- Tokyo Metropolitan Koishikawa secondary education school

Small windmill
production diary
Natural energy research group
(Next to 3F physics laboratory)
http://contest.japias.jp/tqj17/170009
http://diy-windmill.jp/
http://風車を作ろう.jp/
Thank you for visiting it.