 |

HOME>Tour to learn>Future forecast map>The times of low birth high death
 |
■■We will expect what happens when Japan fell into low birth many death here. |
 |
It has been taken a lot up in news or a book that Japan was low birthrate
and aging society.However, in late years do you know that Japan is shifting
to the low birth many death society which moved from low birthrate and aging more?
|

It's thought little, that the situation of "few fortune numerous death"
with a lot of senior citizens who die of the life expectancy comes to the
child being born with progress of the declining birthrate and a growing
proportion of elderly people in recent years in Japan. |
【 ChangeofJapan's populationpyramid】 |
 |
"Why now, reform's the need?" (Ministry of Health, Labour and
Welfare) quoted from "change in Japan's population pyramid."
(http://www.mhlw.go.jp/stf/seisakunitsuite/bunya/hokabunya/shakaihoshou/kaikaku_1.html) |
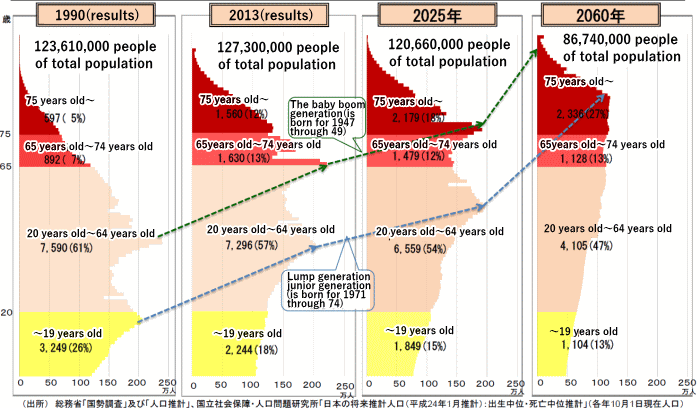
This graph predicted the change of the population pyramid from 1990 through 2060.
It is predicted that population 75 years or older continues increasing
from 5,970,000 people of 1990 with 23,360,000 people in 2060. |
|
1990年 |
|
2060年 |
| 75歳以上 |
597万人 |
 |
2,336万人 |
| 5% |
27% |
| 65~74歳 |
892万人 |
 |
1,128万人 |
| 7% |
13% |
20~64歳
(働き盛り) |
7,590万人 |
 |
4,105万人 |
| 61% |
47% |
| 19歳以下 |
3,249万人 |
 |
1,104万人 |
| 26% |
13% |
|
And it is population to 64 years old to decrease instead. The 20~64 year-old population in its prime greatly decreases with 41,050,000 people from 75,900,000 people of 1990 in 2060.
The elderly person in 2,060 years 65 years or older is estimated at 40%
of the whole.
|
| When the birth rates less still increase to a scary thing, the population
is almost reduced to half in next 50 years. |
↑TOP |
 |
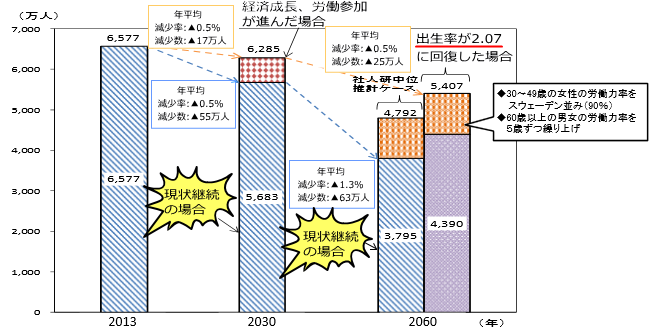
With a decrease in population of Japan, it is estimated that the labor
force greatly decreases.
Please look at the graph below. According to the "Labor Force Survey"
by the Ministry of Internal Affairs and Communications, as shown in the
bar chart of  in the remains of the current situation where labor force participation
does not proceed at all of the women and the elderly, the labor force population in '60 37.95 million people and now than 42%
it is expected to decrease. in the remains of the current situation where labor force participation
does not proceed at all of the women and the elderly, the labor force population in '60 37.95 million people and now than 42%
it is expected to decrease.
If, birth rate has recovered to 2.07, and women working in Sweden par,
even as the elderly worked five years longer than currently, in 2060 called
to decrease to about 55 million people (far right of the bar graph  ) )
|
| 【 Estimates of labor force】 |
 |
Source:「For the labor force population and the future of economic growth」("
Growth and development " Supplement March 12, 2014)(Cabinet Office)(http://www5.cao.go.jp/keizai-shimon/kaigi/special/future/0312/shiryou_02.pdf)After
processing them cite
(Note) 1. Ministry of Internal Affairs and Communications, "Labour
Force Survey", the Ministry of Health, Labor and Welfare Employment
Policy Study Group, "the labor force supply and demand estimates"
(2014), National Institute of Population and Social Security Research "Japan's
future estimated population (January 2012 estimate ) ", statistics
Sweden" Labor survey "based on those that have been created.
"Shannyn Research median estimate case", the National Institute
of Population and Social Security Research (Shannyn Labs.) Is multiplied
by the labor force participation rate in 2060 of sex and age population
was estimated.
|
|
|
|
|
|
The work force that the population of the youth decreases to steadily decreases…Can
you in this way imagine it what kind of thing happens?What will happen
to Japan? |
|
 |
 |
|
|
|
|
|
|
↑TOP |
| NEXT→ |
|
|
|