GIS by Hand
In this research, we utilized the Geographic Information System(GIS). We analyzed the visualized data which are overlaid statistical information on the map.
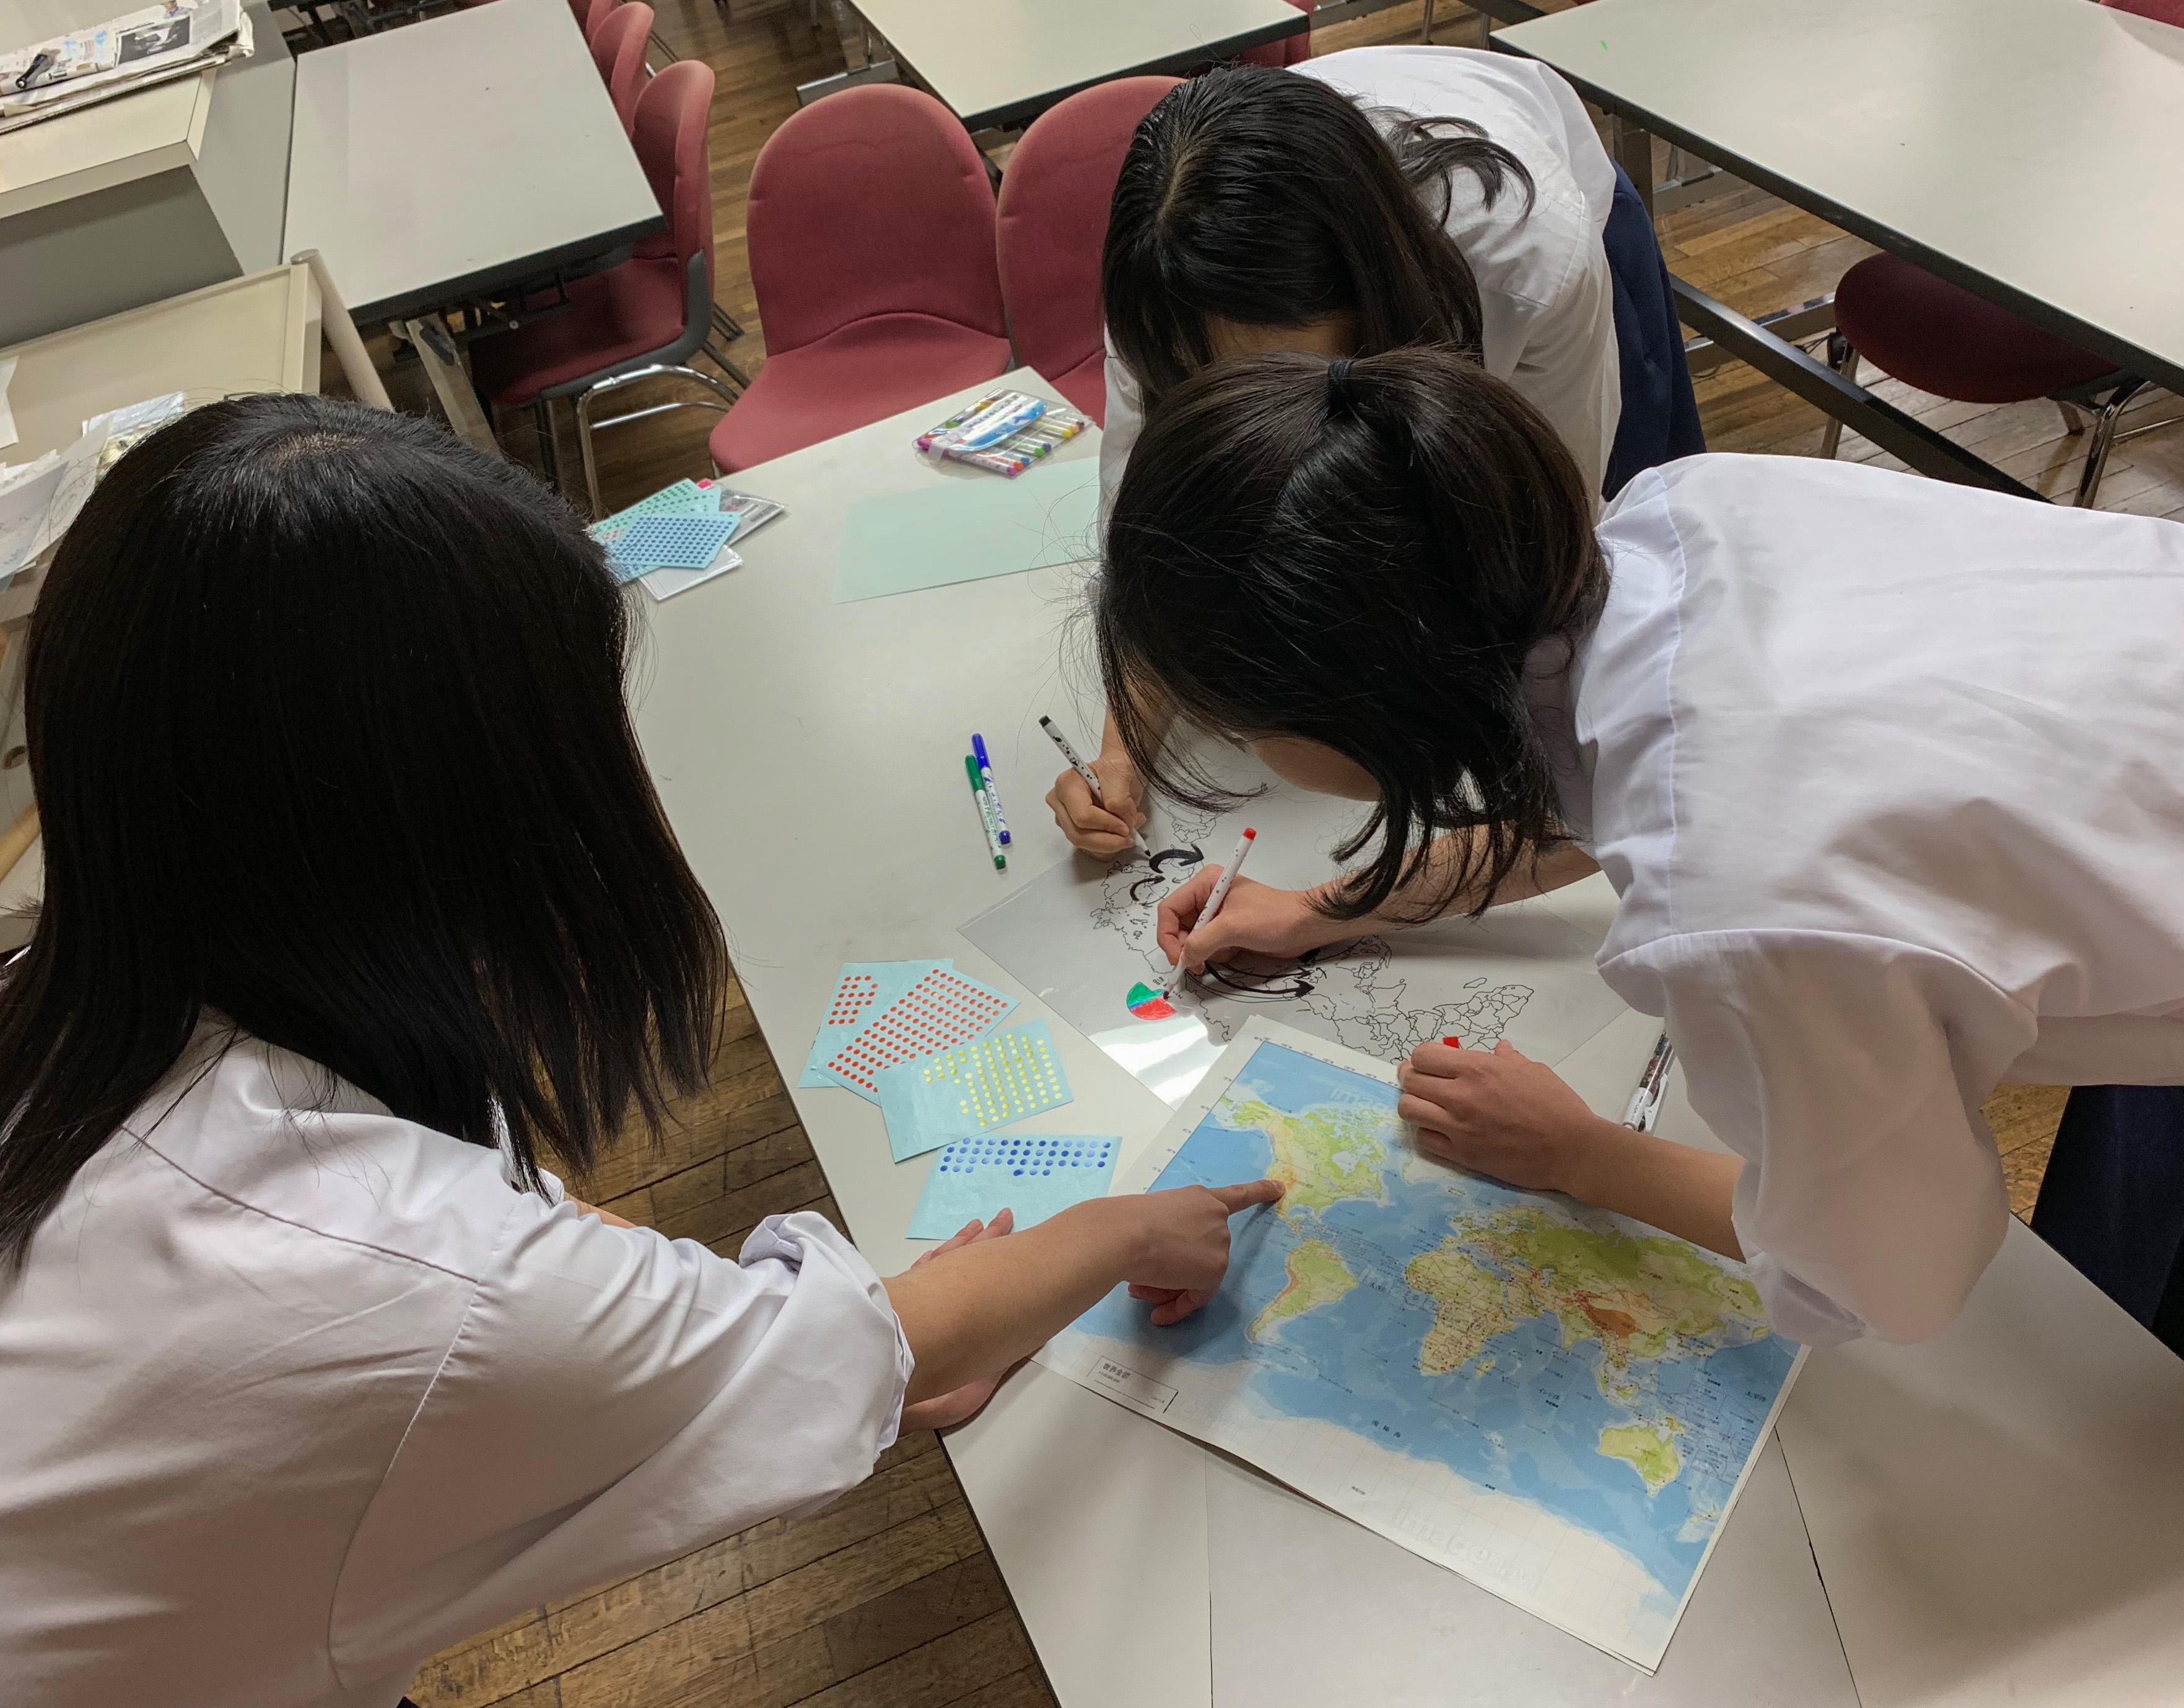
Instead of analyzing the data with a computer, we draw up the map by hand at first. This part introduces our mapping process.
Mapping Process
1. Gather Data for Mapping
First of all, we gathered data to visualize and analyze. We decided to draw two types of map and overlaid the following data on each of the map.
Map 1
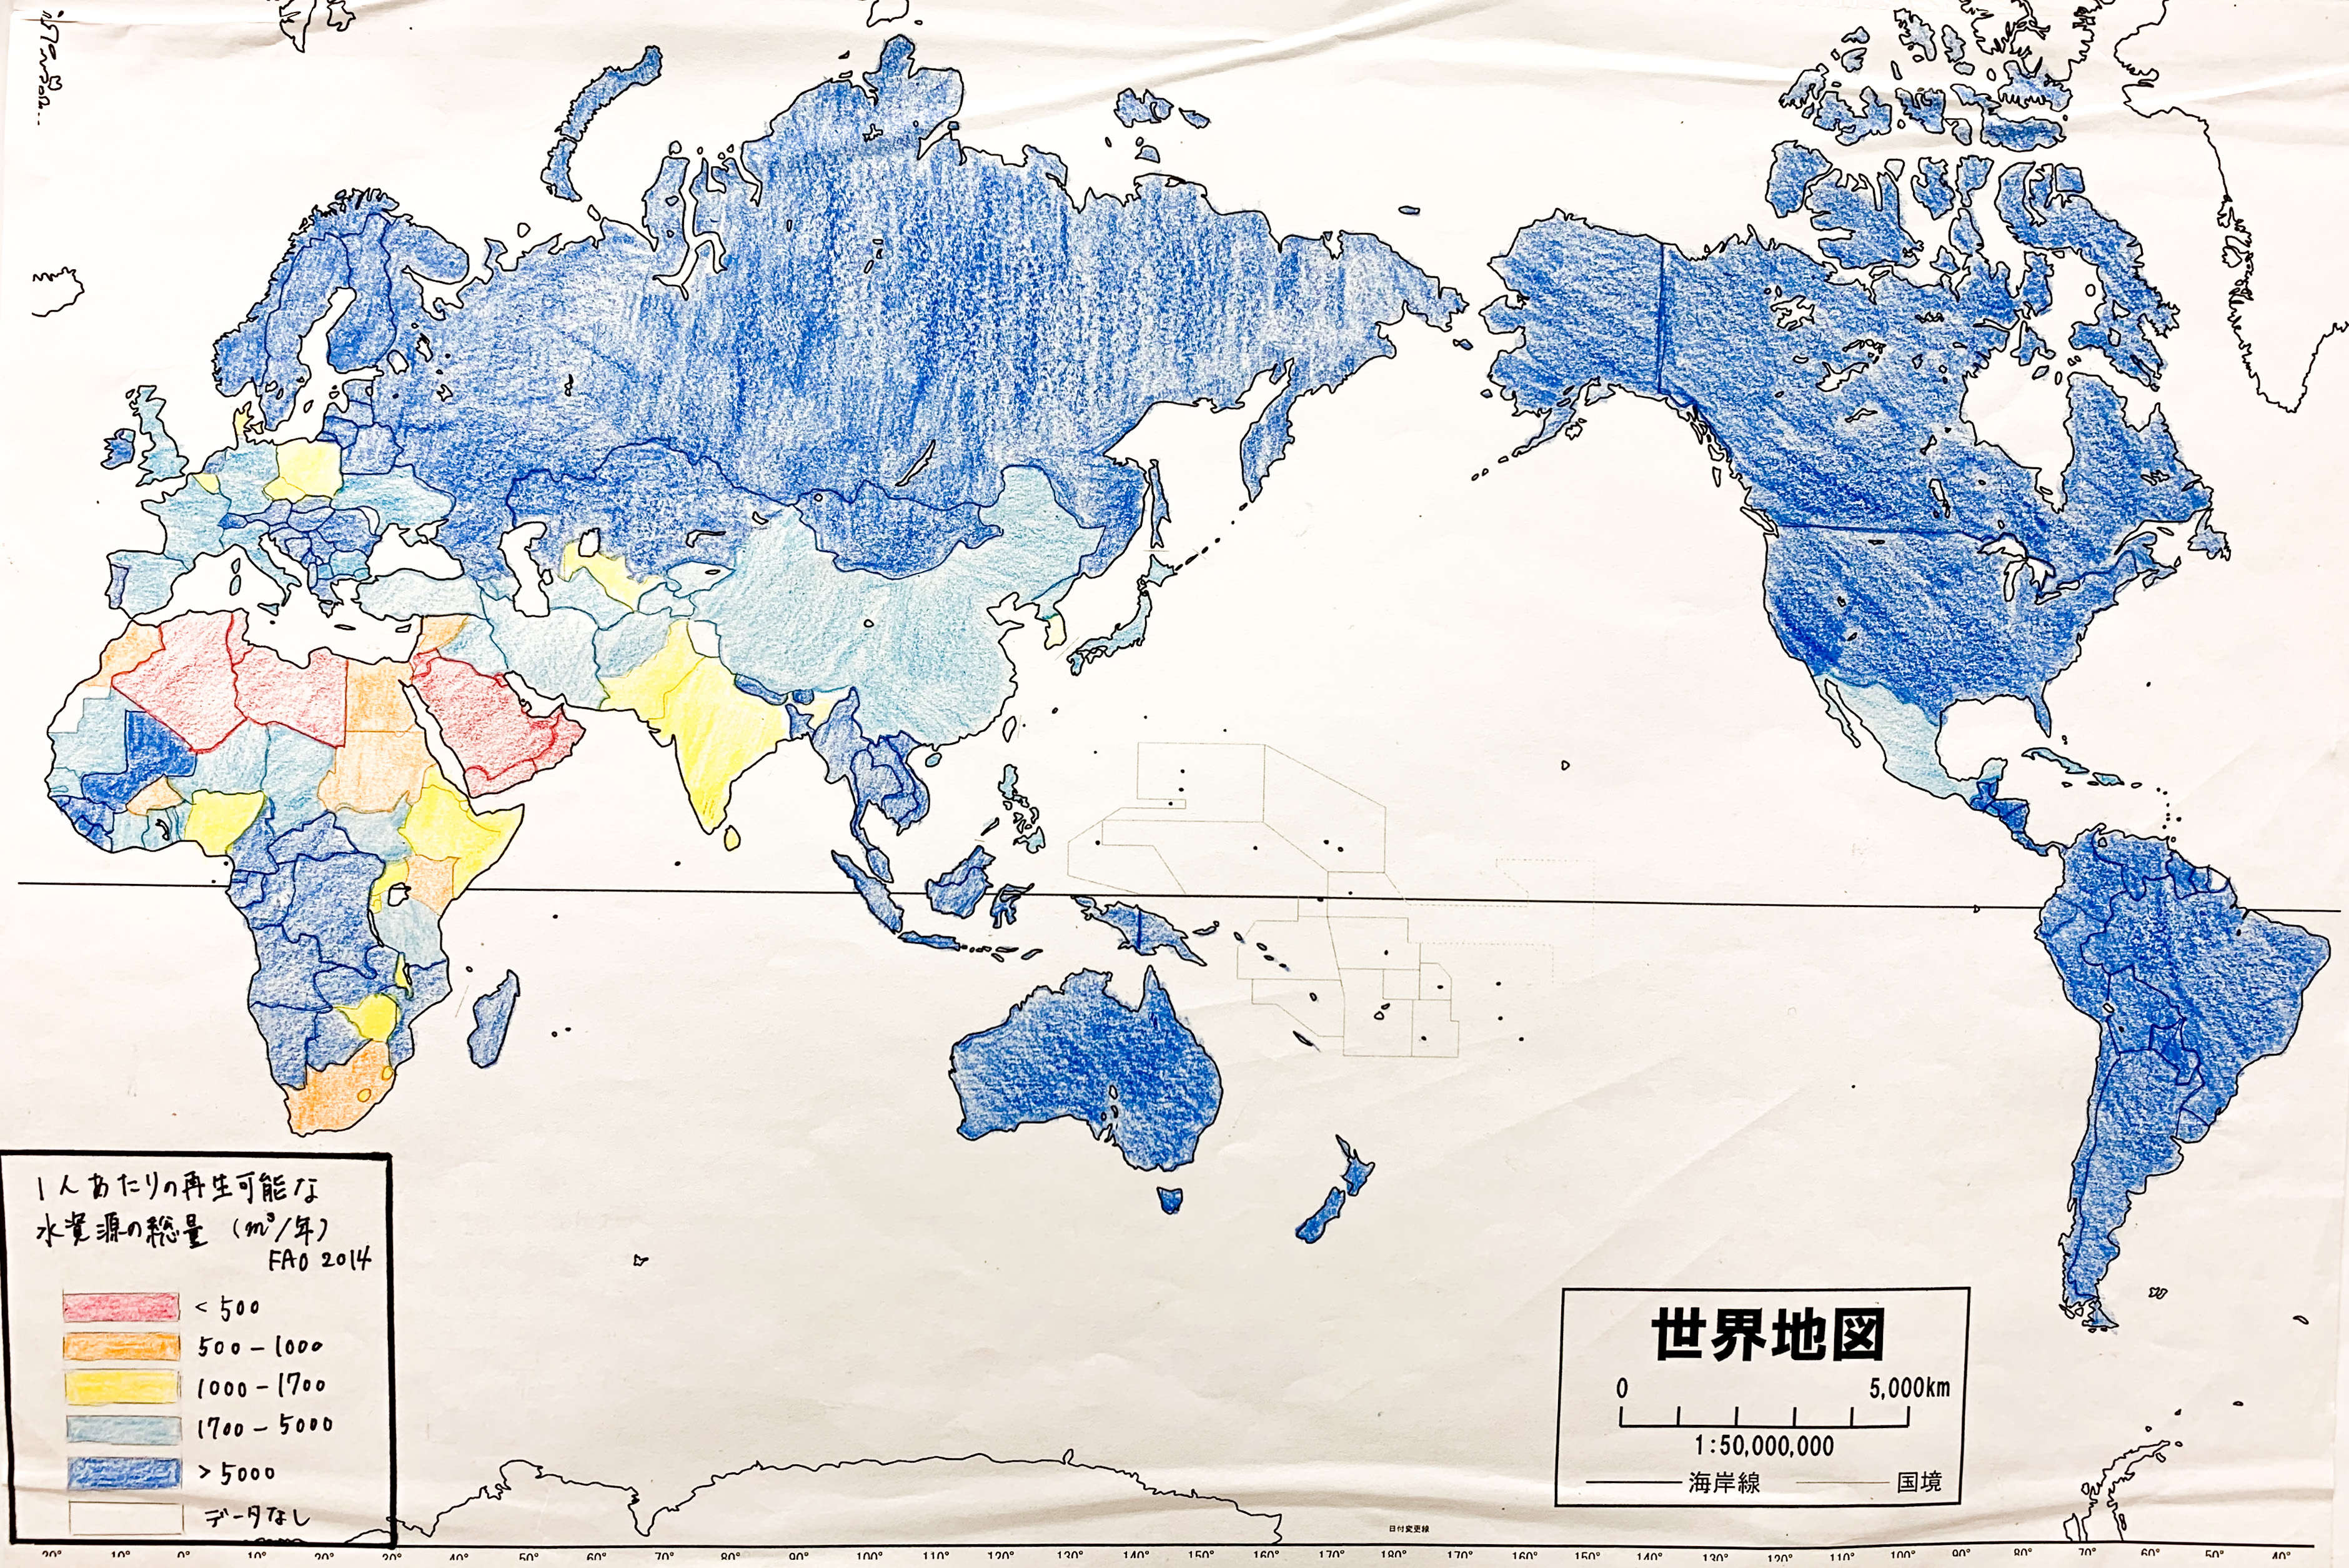
1. Renewable water resources per capita
2. Locations of rivers and mountains
3. The level of water stress
Map 2
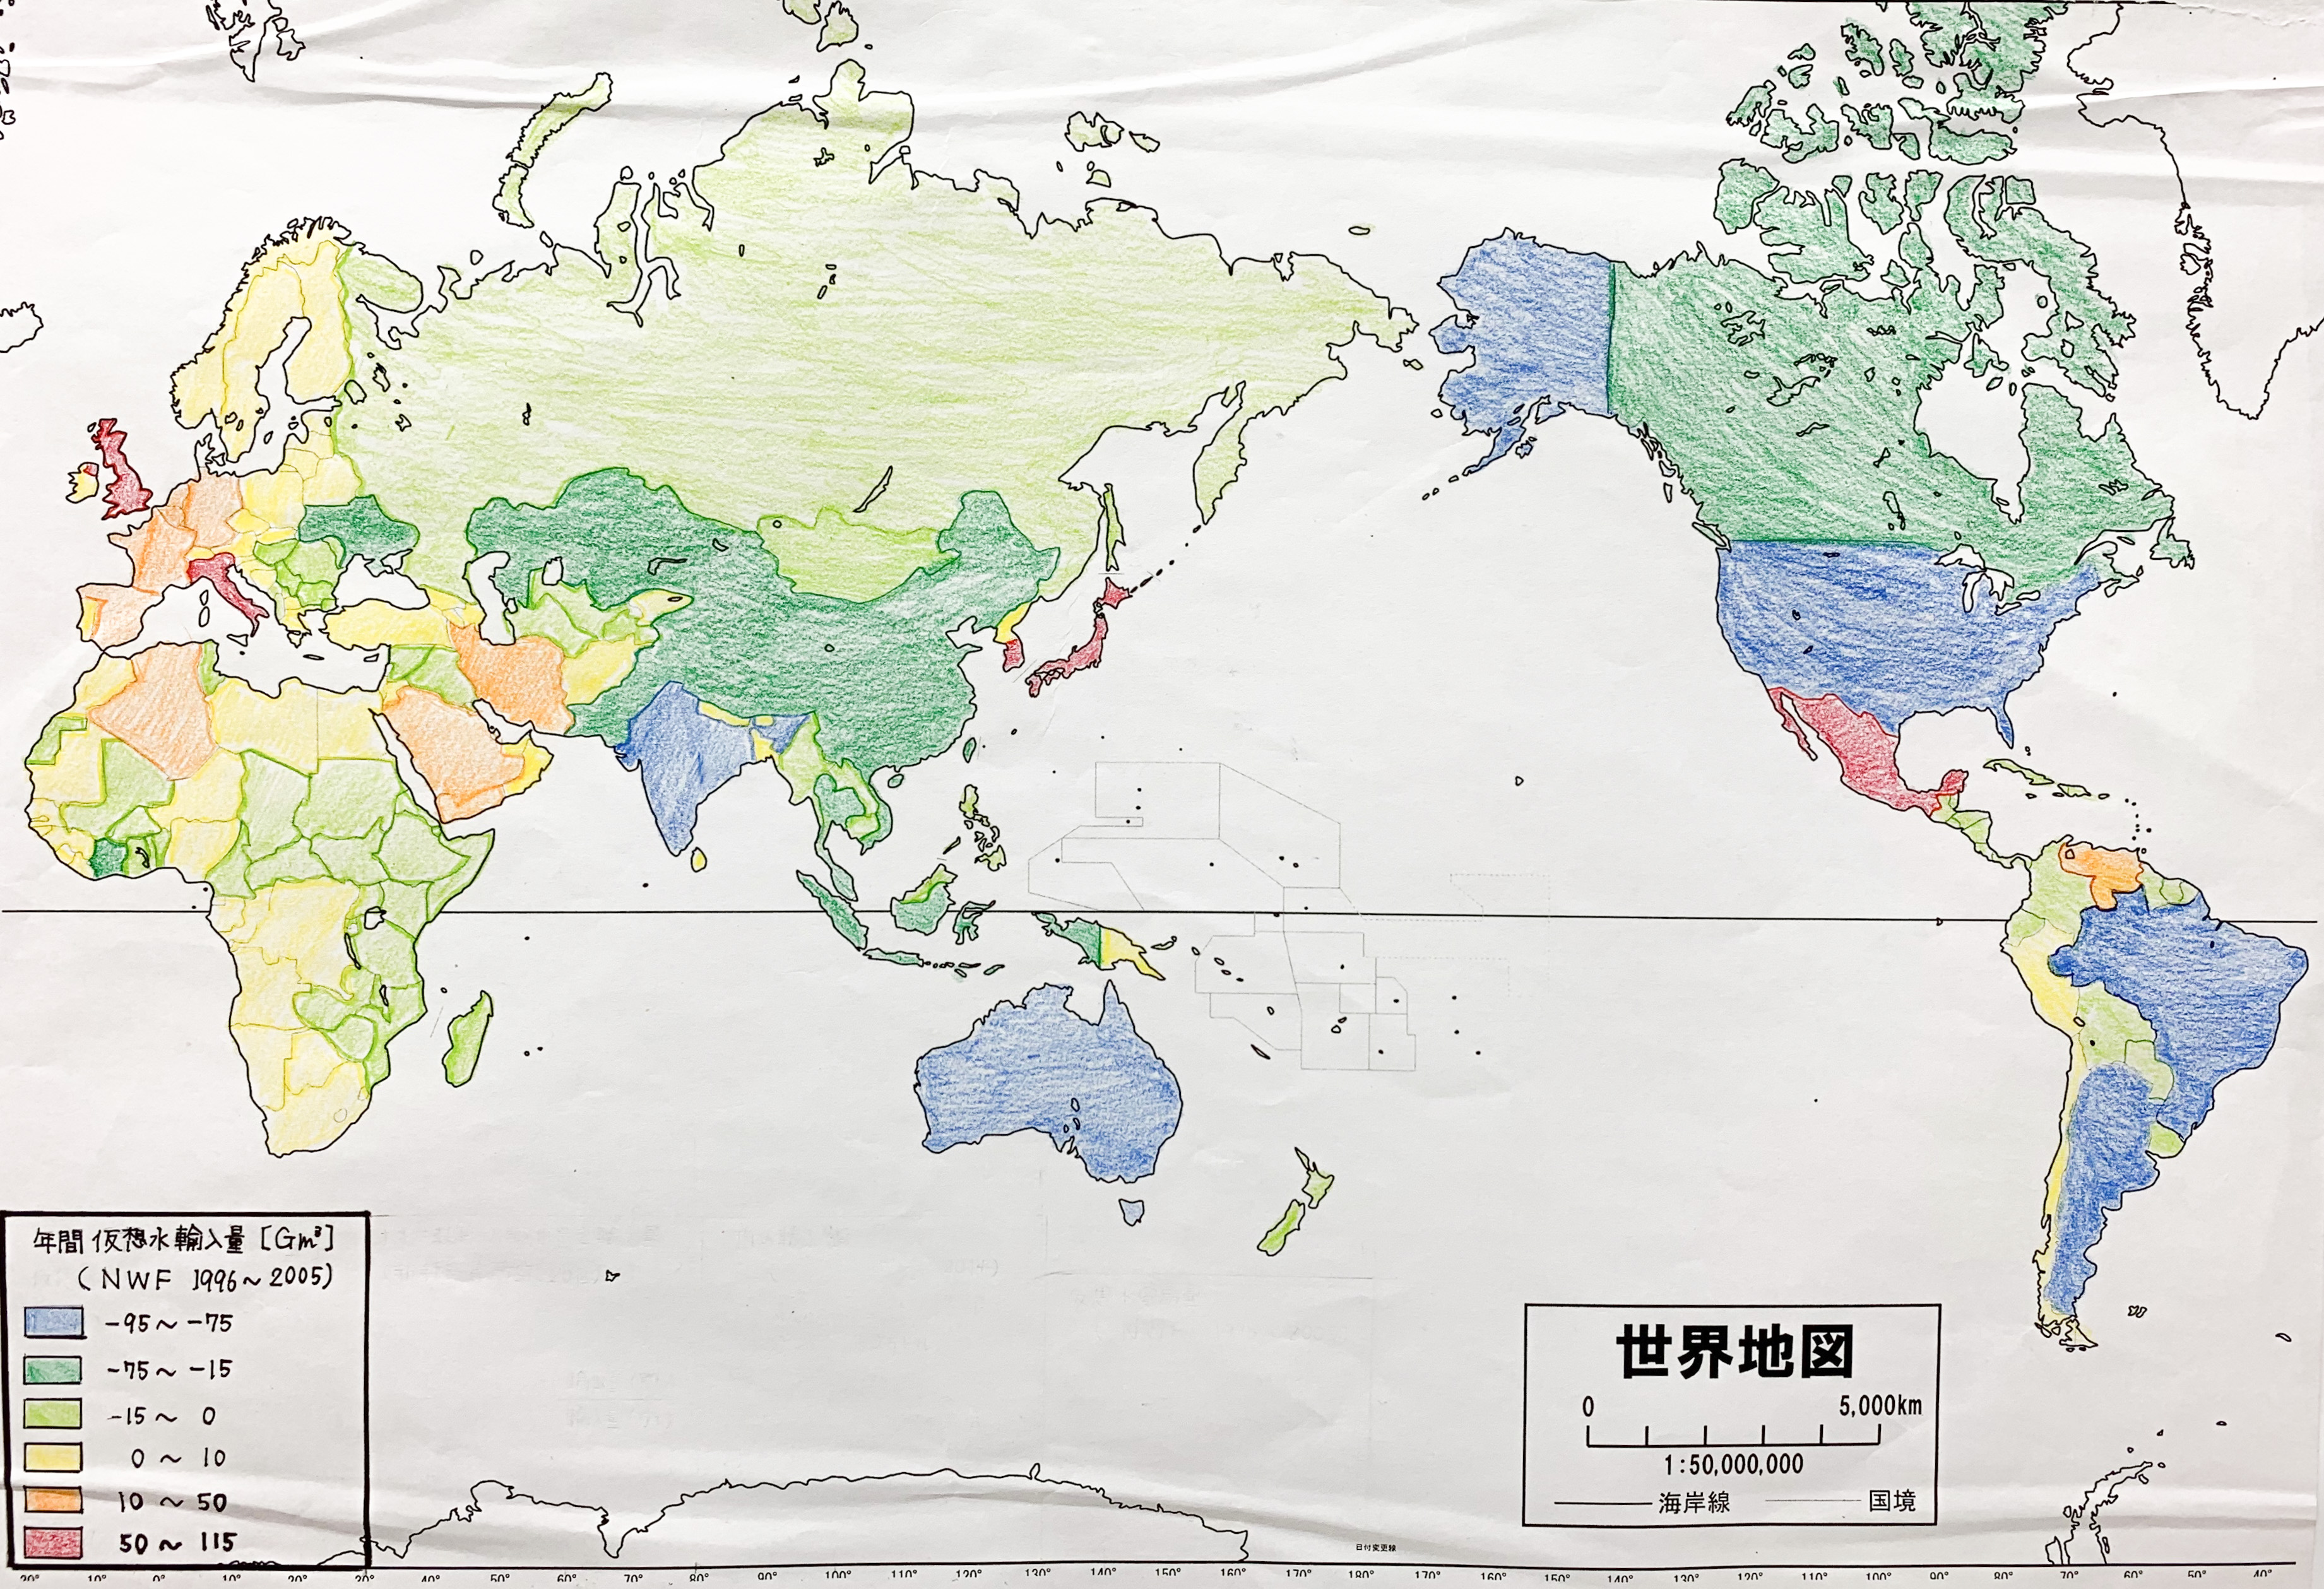
1. Virtual water imports
2. Meat and edible meat offal imports
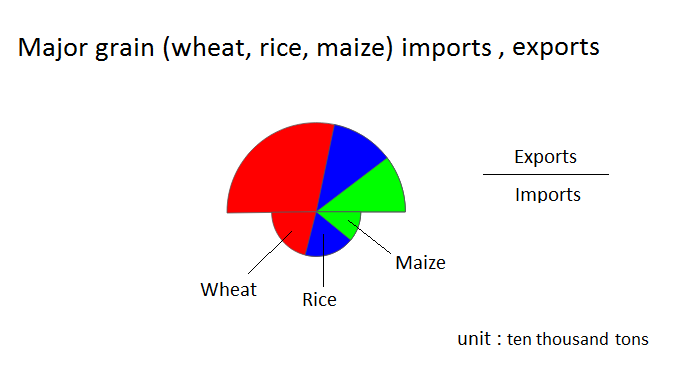
3. Major grain (wheat, rice, maize) imports
4. Virtual water trade
2. Visualize the Data on the Map
Next, we displayed the data on each map.
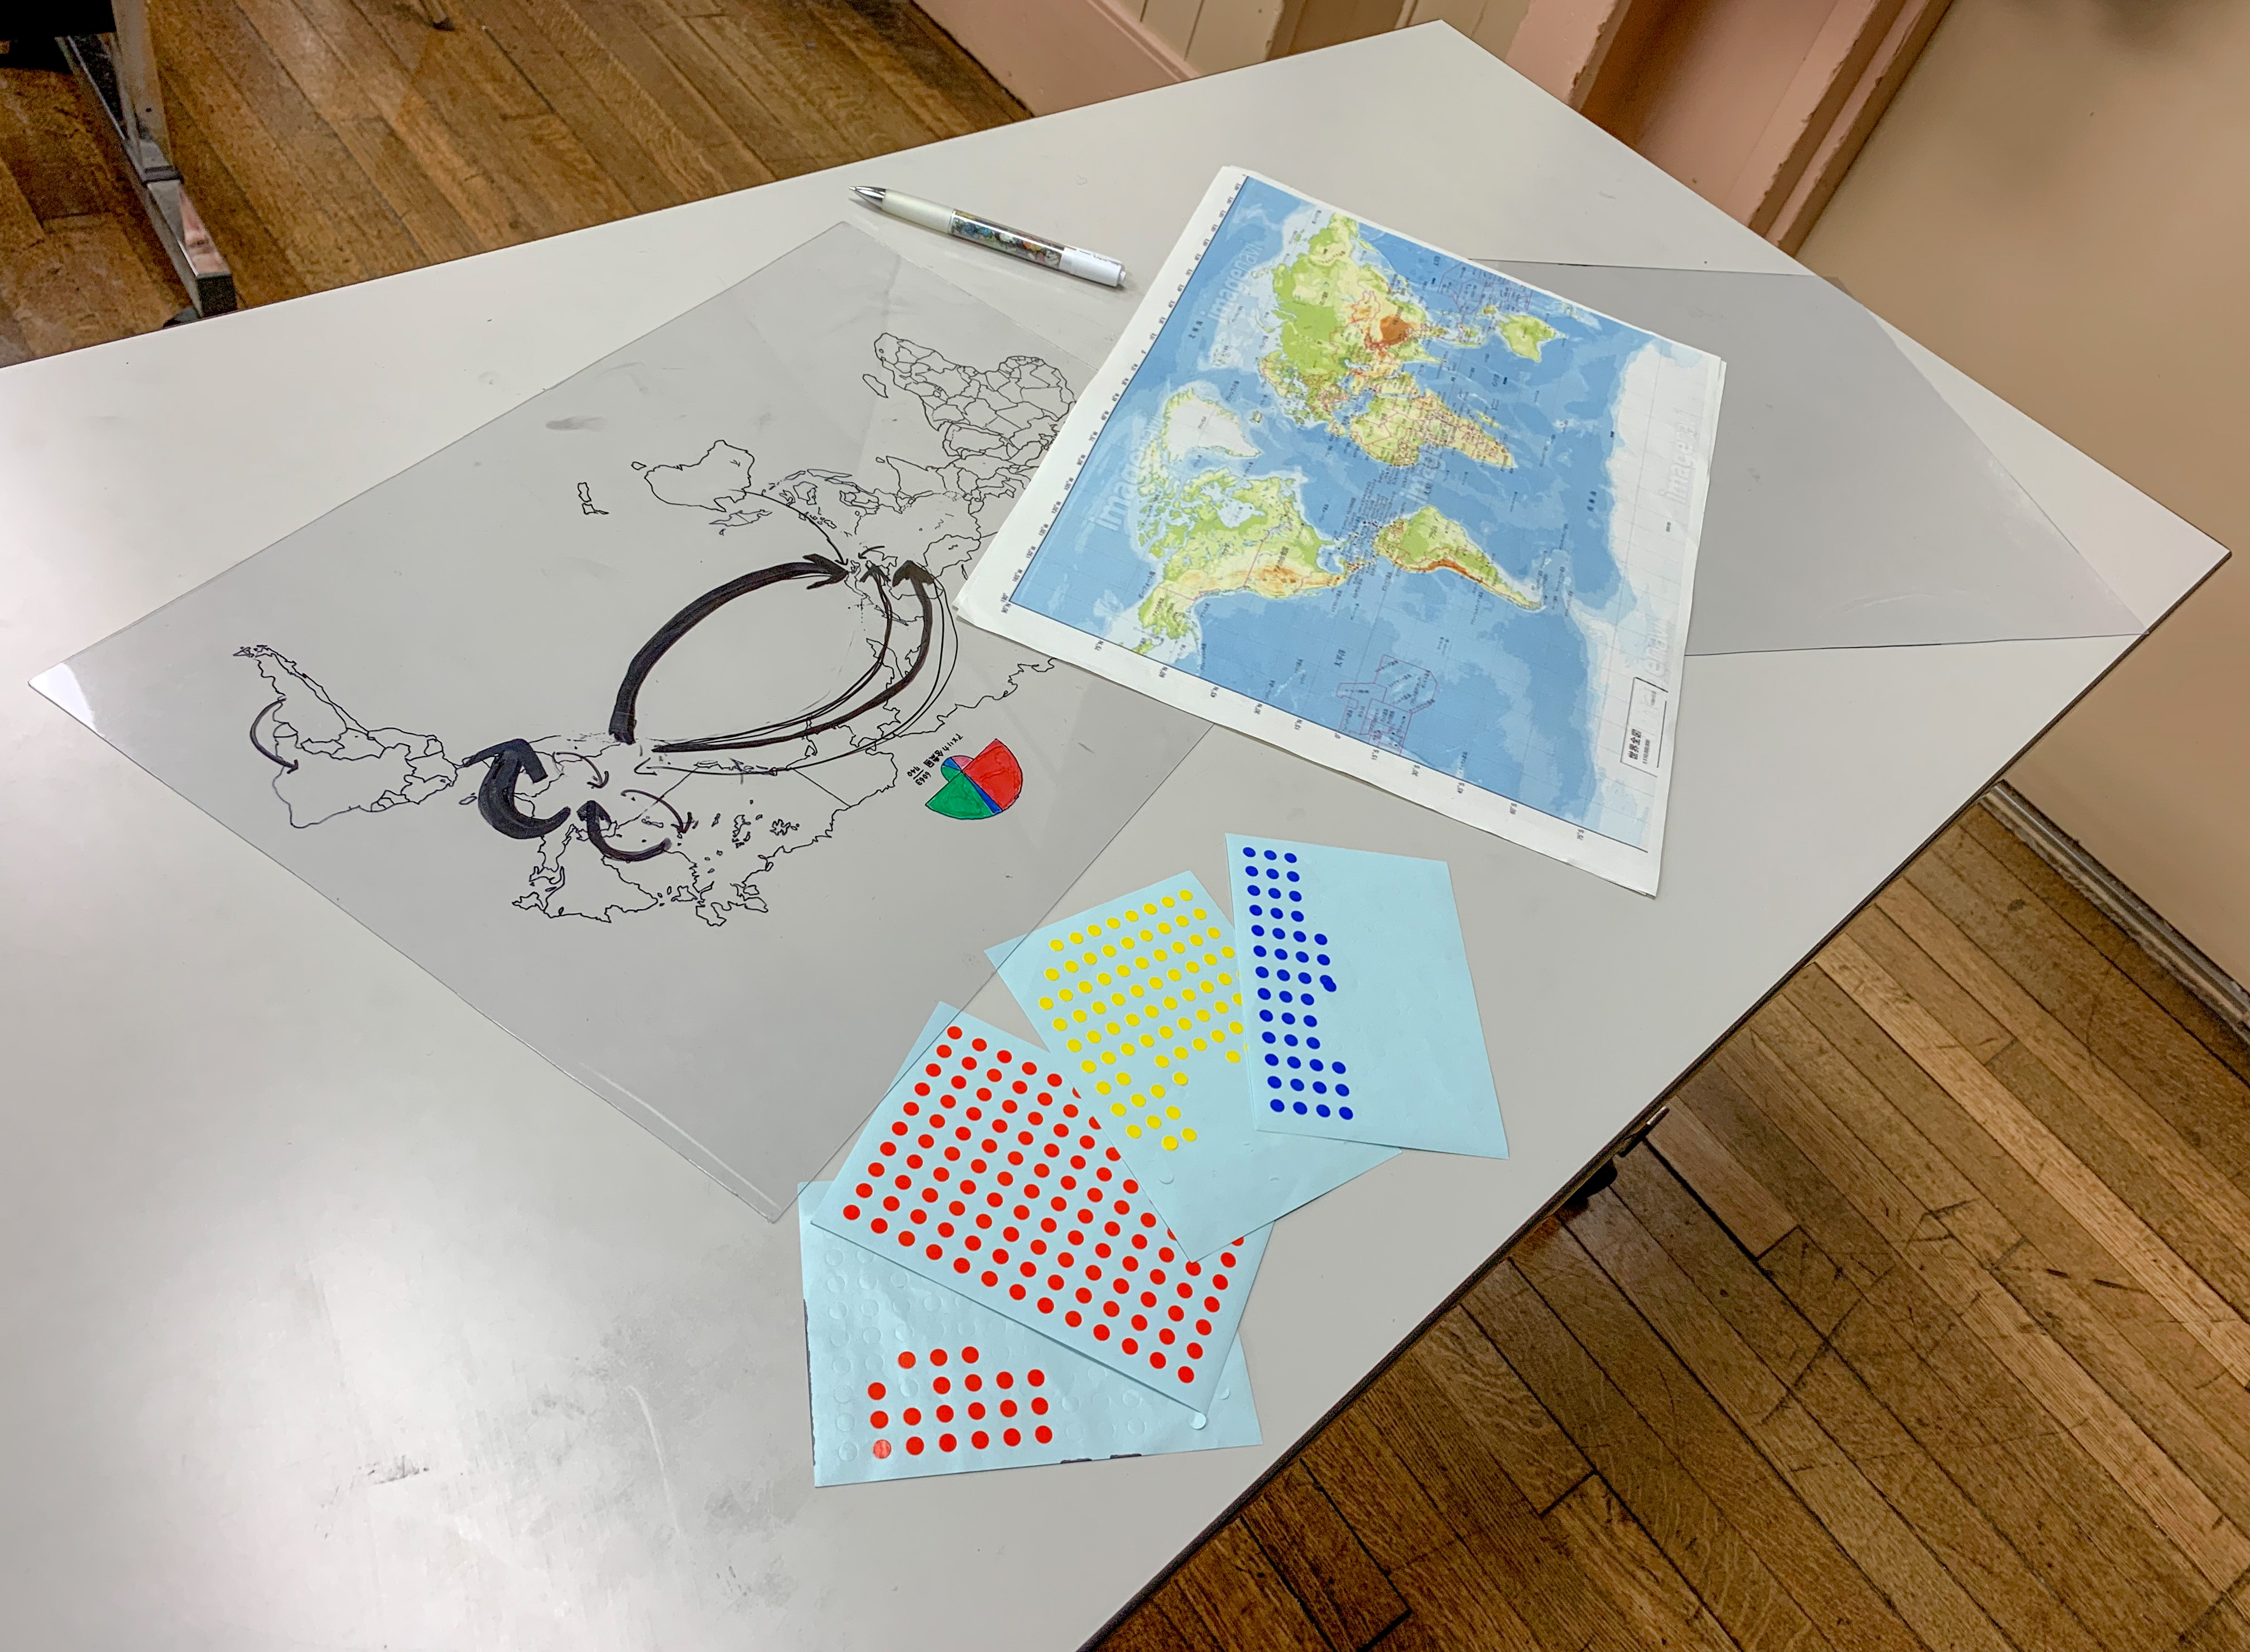
Point 1: Use transparent acrylic panels
The advantage of viewing multiple data on one map is that we can compare multiple data overlaid up and down. For doing that we draw world maps on transparent acrylic panels and visualize the data on them.
Point 2: Display the data with various thematic maps
To make the data more visible, we devised the kinds of thematic maps. You will see maps like choropleth map, symbol map, dot map and flow map below.
Map 1
Renewable water resources per capita… We used a choropleth map. The countries are color coded on a black map.
Locations of rivers and mountains… We drew rivers and mountains on the map.
The level of water stress… We classified countries by the level. We also put color stickers in descending order of seriousness - red, yellow, white.


Map 2
Virtual water imports… We used a choropleth map. The countries are color coded on a black map.
Note: In this research, we used a choropleth map to display “amount”, thus it seems to be large amount of imports in large countries. We noticed a point for improvement, using a symbol map.
Meat and edible meat offal imports… We used meat mark to make you be able to see the differences of imports each countries. A meat mark shows the amount of $500,000 imports. The number of marks shows meat and edible meat offal imports.
Major grain (wheat, rice, maize) imports... We used a pie chart. The size of pie charts shows imports and exports. The upper half of a chart shows exports and the lower one shows imports. We also put color stickers the proportions of wheat, rice and maize imports.
Virtual water trade… We used a flow map in order to see the flow of virtual water. As the amount of virtual water is larger and larger, the arrow becomes thicker.


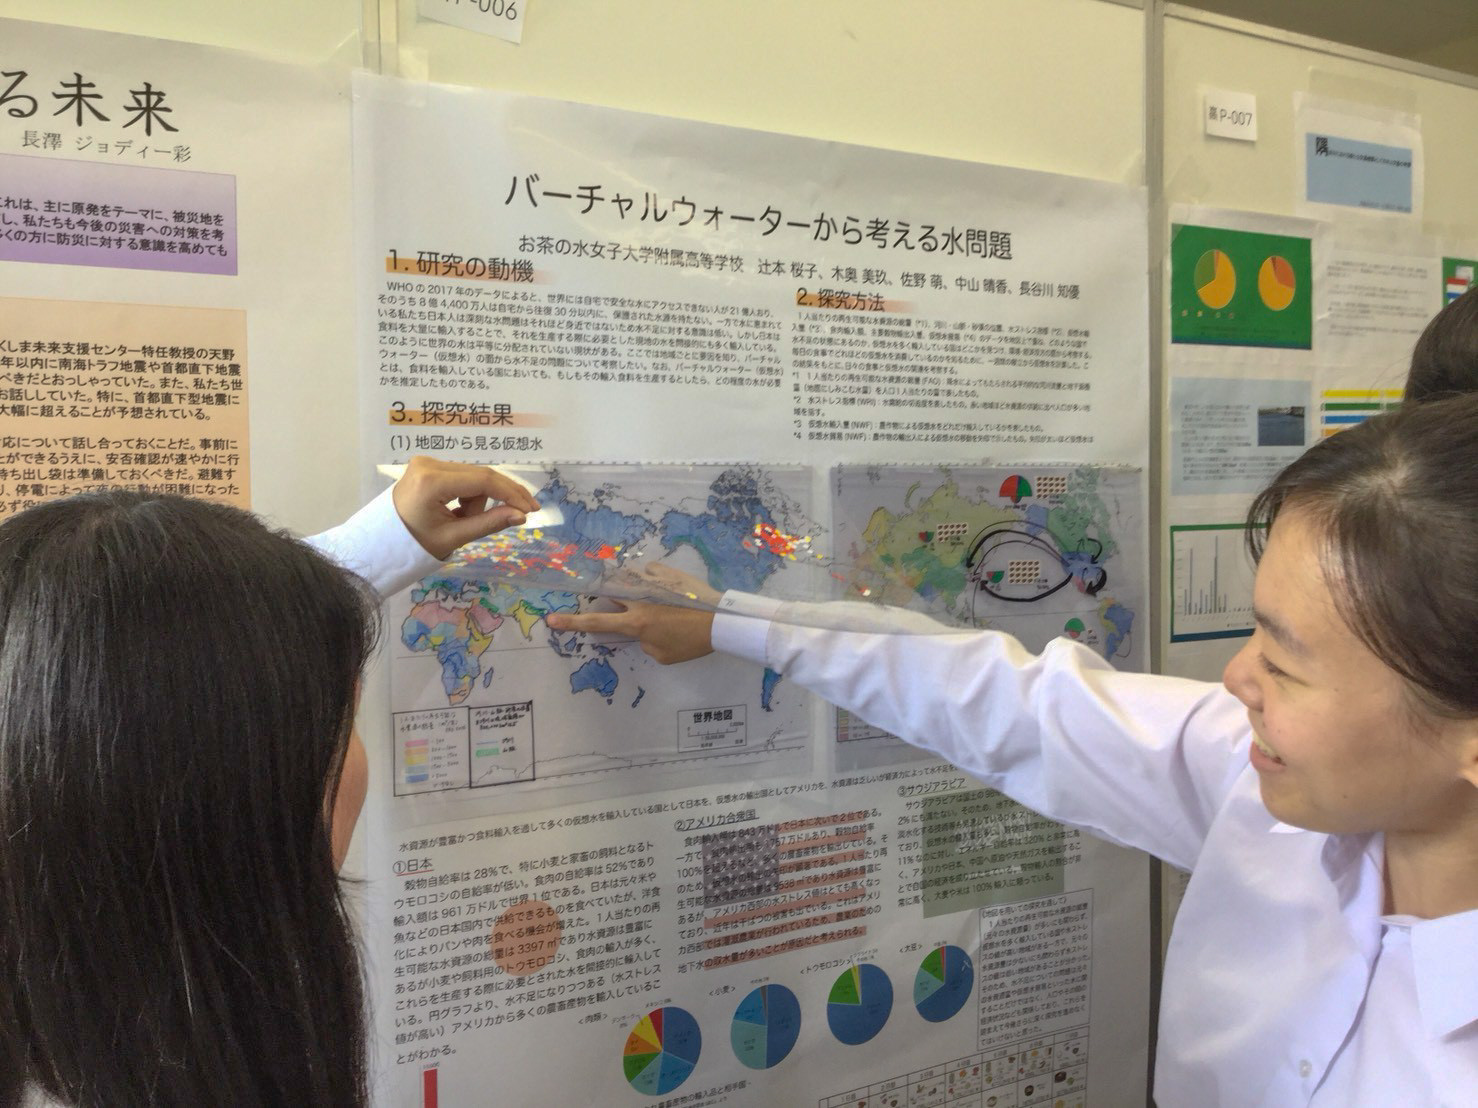
3. Overlay the Maps
By overlaying the maps, we can analyze multiple data on the only world map.
We spent about 10 hours to draw these maps!
These days, digitization is making progress in the area like this, but it led to understanding water scarcity and crisis in the world deeply that we had drawn the maps by hand.