GIS By MANDARA10
On the basis of the maps we created in the summer, we set about mapping by using free GIS software “MANDARA10.” This part introduce advantages of GIS.
If you want to know more about how to use it, click here. (PDF were created by Mrs. Numahata, our supervisor). MANDARA10 manual (PDF)
This is a manual distributed in the global geogrphy class for first-year students of our school.
How We Operated MANDARA10
1. Colors of the Map
The color part seems to be not important at the very beginning, but turns out to be one of the important elements in our practice.
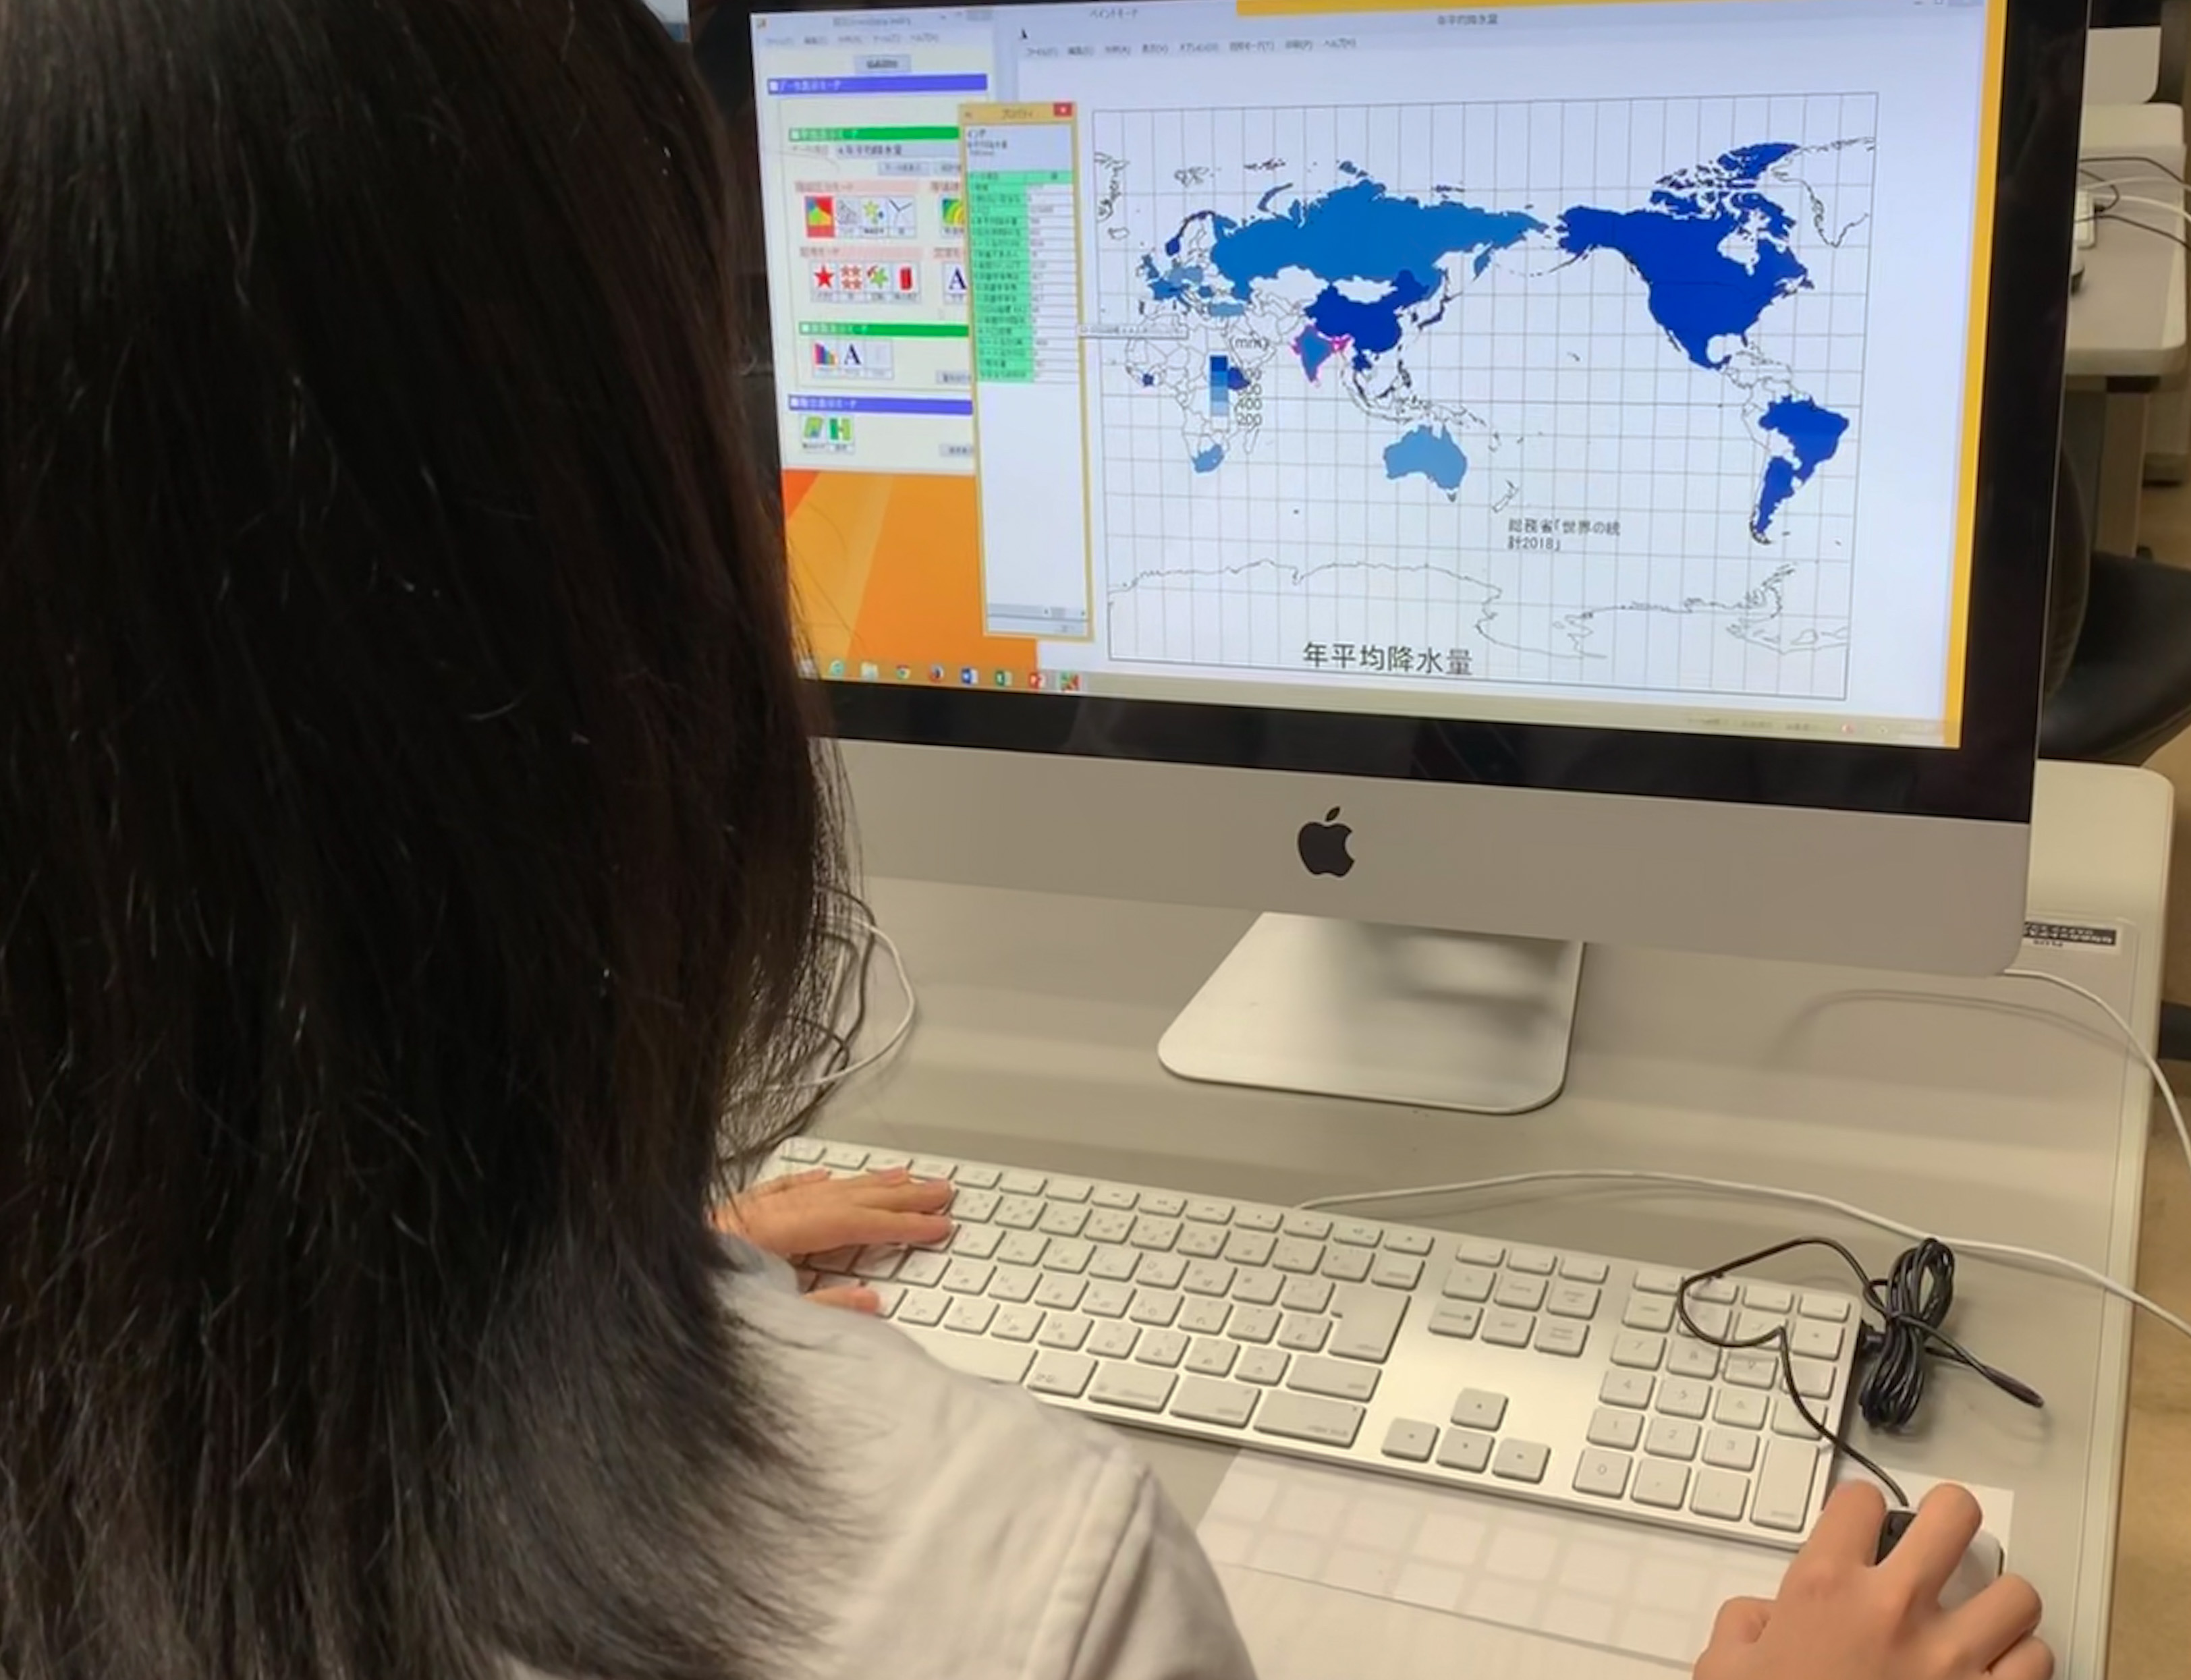
Take a look at the maps we created.
The figure on the rights shows “Renewable water resources per capita.” It shows that as the amount of renewable water resources becomes larger and larger, the color-blue becomes deeper. It may conform to the image of blue: abundant water.


Meanwhile, upper 2 figures show that as “The level of water stress (%)” becomes bigger and bigger, the color-red becomes deeper. If we use only one color such as blue, our map would be very confusing.
Like this, we have created some easy-to-follow maps. When it comes to twater, we marked elements which lead to advantages blue, and elements which leads to disadvantages red.
It is important to make figure easy to understand and let people know the ideas at a glance.
2. The Classification
Here are the classification of “The illiteracy rate (both sexes)”.
In the world, there are low literacy rate countries like developing countries. There are also high literacy rate countries like developed countries. We wanted to show low literacy rate countries, so we divided the class finely.
The situation that illiteracy is less 5% or less quite different from one is 10%.

3. Thematic Maps
From our experience of creating handwritten maps we came to the conclusion that thematic maps suit to the data. When using MANDARA10, as there are multiple data overlaid in one map, we need to pay attention to the readability of the map.
Based on several maps, we showed “Renewable water resources per capita” with a choropleth map. We also overlaid different statistics information over it.
Basically, we used a choropleth map for relative value like proportion (%) , and used a symbol map for the size of circle for amount ( absolute value).
The Advantages of Using GIS
1. Visualize hidden Relation
First of all, we posited that environmental elements are related to the problem which is whether people could access safety water or not. However, the results came differently. After we input various information such as GNI and literacy rate, we found that social elements also play an important role in water problems.
By overlaying maps, we were able to find out the hidden correlations. Overlaying world maps enables us to compare situations in different countries and regions.
2. The Use of Digital Data
Thanks to MANDARA10, we were able to completed the work within 20 minutes.It took us 10 hours to do the same thing when we did it by hands. We can use the software as long as we have excel data. Using excel make it easy for us to add data and change the color of maps. We can also see the results of the data analysis visually.
Using MANDARA10 offeres us a new way of data analysis.