What Makes You Happy? Please tell me your pleasure

- Our Happiness
The result of Our Ranking of happiness
Contents
1Our happiness
2-1Actual conditions survey of happiness
2-2The results of the questionnaire for students in the world
2-3The results of the questionnaire for students in Japan
2-4The conclusion of the questionnaires
3-1Our Ranking of happiness
3-2The result of our ranking of happiness
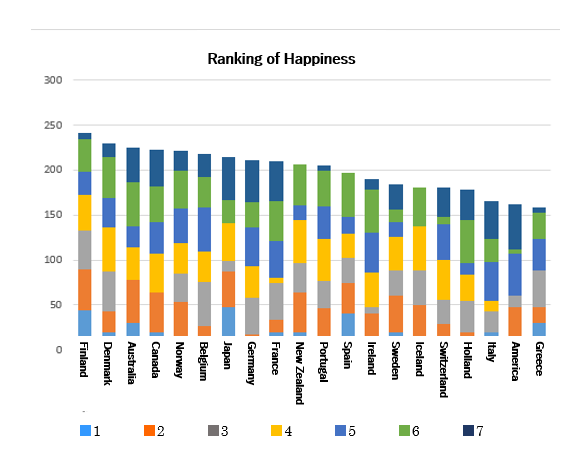
This is the ranking we made from our group's own aspect, using the following seven data.
The references and the year the investments were done are in each blank.
Back→The indexes we used in making a ranking of happiness
1.National holiday(World Welfare Research 2014)2.Air pollution (WHO 2014)
3.Diffusion rate of waterworks(WHO 2015)
4.Grobal safe index (IEP・2016)
5.Energy intake from food (Collection of World National Census Pictures 2015)
6.Enrollment rate of secondary education (World Data Atlas 2012)
7.GDP per capita (Collection of World National Census Pictures 2015)
In order to rank the countries, we gave points from 50 to 1 from top to bottom to each of the top 50
countries of each index and summed it all up.
(This graph is original)

First place Finland
Second place Denmark
Third place Australia
Fourth place Canada
Fifth place Norway
Sixth place Belgium
Seventh place Japan
Eighth place Germany
Ninth place France
Tenth place New Zealand
Japan placed the seventh in the ranking,
which is much higher than the original ranking by the United Nations,
even though it did not rank above fifty in the amount of energy people
get from food and didn't get any points.
Moreover, too much energy leads to obesity, which cannot be regarded as happiness.
Looking at it in detail, because almost all of the developed countries have a high
standard of waterworks and school attendance, Japan scored comparatively low in them
than in other indexes.
By looking at it from our point of view, we managed to get a different result.
We look forward to
discovering indexes to measure happiness of high school students in particular.

