
Verification of leaflet
Check whether our leaflet is really effective.
We examined how we could improve people’s awareness of heatstroke by using the leaflet which we introduced on the front page with the worksheets and questionnaires.(Click here to move the page about questionnaires)
Preliminary questionnaires about knowledge of heatstroke
↓
Distribute the leaflet
↓
Answer the worksheet
↓
Post-questionnaires to verify the effect of the leaflet
The first and second grade 220 students cooperated in this way.
We would like the students to feel heatstroke more familiar, so we made two types of worksheets for high school students and for everyone.
Here are our original worksheets →
for high school students / for everyone(PDF)
Now, let’s watch the consequences of advance and posteriori questionnaires.
◎ Preliminary questionnaires
Q1. Do you know the index, WBGT? (Quantity of responses 216)
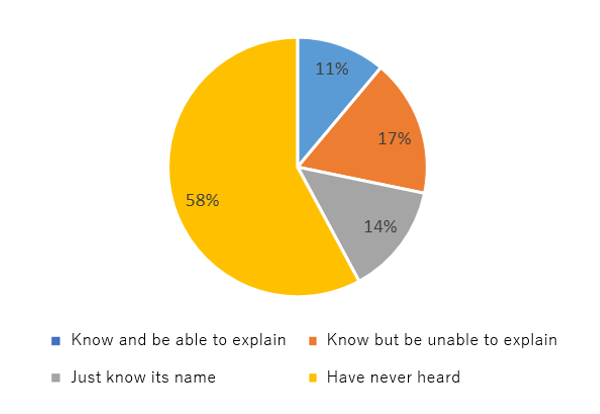
WBGT is used to restrict club activities at our school to prevent heatstroke but 58% answered “do not know”. Also, many students who answered “can explain” cannot answer the WBGT value, which is dangerous correctly like 35℃ and 28℃. (Correct answer is 31℃.) WBGT is used in many cases but recognition of it is low.
Q2. What do you think which area’s rate of heatstroke patients by EMS (Emergency Medical Service) is high? (the number of responses 218)
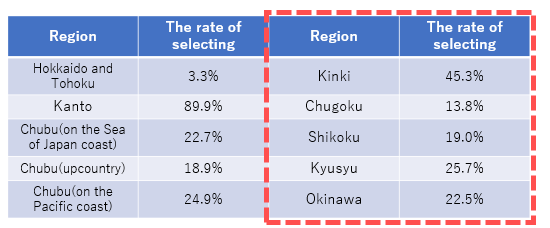
The answer is “Western Japan” so the right side of this table is the answer, but Kanto region was chosen more than Western Japan. Chugoku and Shikoku region’s rates of selection were around the 10% range and we found the awareness of its risk in these areas is low. There is no area which is not dangerous to get heatstroke around Japan, but it is necessary to let people pay attention to the most dangerous area of heatstroke.
Q3. What do you think which month you should start to prevent heatstroke? (the number of responses 217)
The average was 5.78. Our model answer is May. Most answers were May and June, so we would like many people to know “the early part of May” is the timing to start the prevention.
Q4. How often do you check the highest temperature? (Quantity of responses 220)
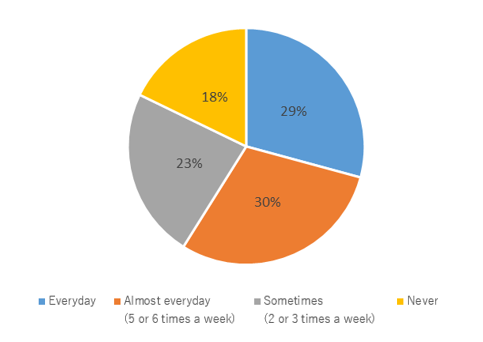
Students who check every day or almost every day were 59% and students who check sometimes or few were 41%. Students who do not check were much more than our thought, so we really want them to check the highest temperature as the first step of prevention of heatstroke.
◎ Post-questionnaires
Q1. Did you get new knowledge about heatstroke? (Quantity of responses 219)
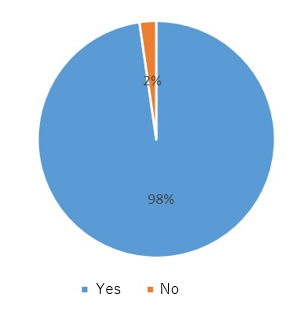
Our leaflet was an effective way to get knowledge about heatstroke for almost all the students. At the same time, we could notice many students do not know about heatstroke.
Q2. Could you raise your awareness of heatstroke? (Quantity of responses 219)
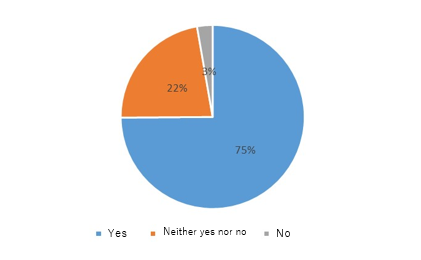
75% students answered they could be more aware of heatstrok and its prevention. The purpose of the leaflet is awareness raising, so we think we achieved one of our goals.
Q3. Comparing what you were before reading the leaflet, do you think you care about heatstroke more seriously,more like your own problem? (the number of responses 218)
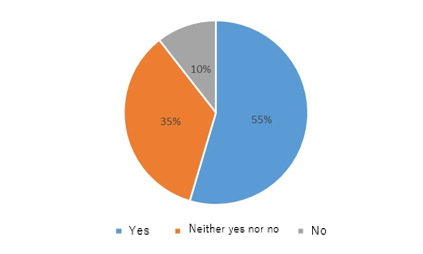
It was the important slogan, heatstroke is not someone else’s problem. Over 50% students answered that they could think about heatstroke more seriously, so we can say it is possible to raise awareness by the leaflet.
Q4. Can you explain the index, WBGT?(the number of responses 218)
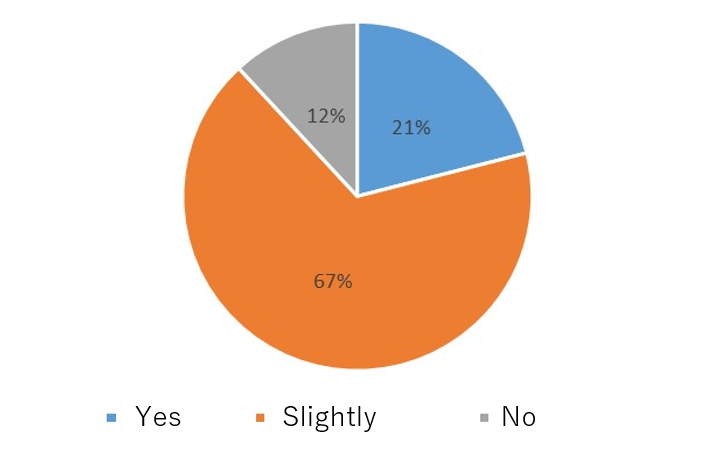
Students who answered that they do not know the index, WBGT in advance questionnaires and 88% of the students who answered “can explain” or “can explain a little” so we could prove the effect of the leaflet.
Adding to these questions, we let students to write “What do you come up with when you hear of the measures of heatstroke?” We show the answer which many students wrote.
Water intakes, salt intakes, cooling, rest, sleeping, air conditioner, shade of wood, hat, ice etc...
◎ Post-questionnaires
Check WBGT and the highest temperature, water intakes, salt intakes, rest, cooling, caring about room temperature, May, hat, meal, sleeping, planting trees, death, ice, taking clothes off, caring about own condition, avoiding the sunshine, looking around to see if some people, especially elders are in the risk of having heatstroke etc...
The answers of Post-questionnaires varies compared to Preliminary ones. There were many answers which reflected the contents of our leaflet, so we could check the effect of the leaflet. We would like to have closer examination of the effectiveness of our leaflet, which we believe we can find more effective activities in our further study and project.