
Analysis by region
 In Japan, various kinds of climate exist.
What are the characteristics of heatstroke patients by region?
We used MANDARA10, the GIS (Geographic Information System) soft and created a map with the data as a visual aid to convey the result of the analysis.(Click here for details about MANDARA10)
Prior to the analysis, we compiled the total number of heatstroke patients by prefecture. We used the data of the past eight years and the results are summarized in the map below.
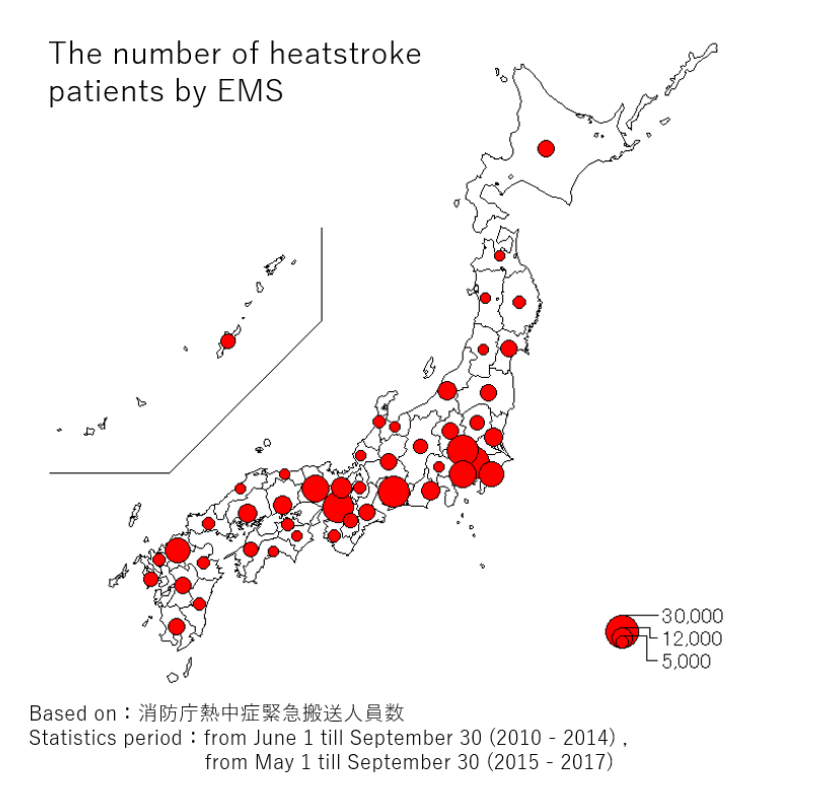
The number of heatstroke patients by EMS (Emergency Medical Service)in the pacific belt centered on the most populous prefectures, such as Tokyo, Aichi, Osaka, and Fukuoka. In addition, those regions are visited by many visitors. Thus, it is necessary to those who are not accustomed to Japan's climate from getting heatstroke.
In urban areas, there are many buildings made of concrete and the roads made of asphalt, not only direct sunlight, but also the radiant heat from the walls of the buildings and the ground increases the risk of heatstroke. This could be related to
heat island phenomenon.
An urban area or metropolitan area that is significantly warmer than its surrounding rural areas due to human activities. According to Japan Meteorological Agency, the temperature rises due to the roads paved with asphalt and the buildings made of concrete which contain little water. The concrete building gives the heat and the atmosphere accumulates it during the day and suppresses the decrease in nighttime temperature. In addition, heat such as the air conditioners is affected, and it is said that the temperature rises about 2℃ in the metropolitan area. (Referring to the story we learned in the field work for Annual report of the Tokyo Metropolitan Research Institute for Environmental Protection.)

It is important to understand that the risk of heatstroke cannot be judged only by the number of the patients.
Look at the following map. In order to analyze the relationship between factors except population and heatstroke patients, it is a comparison of parameter with 100,000 people.
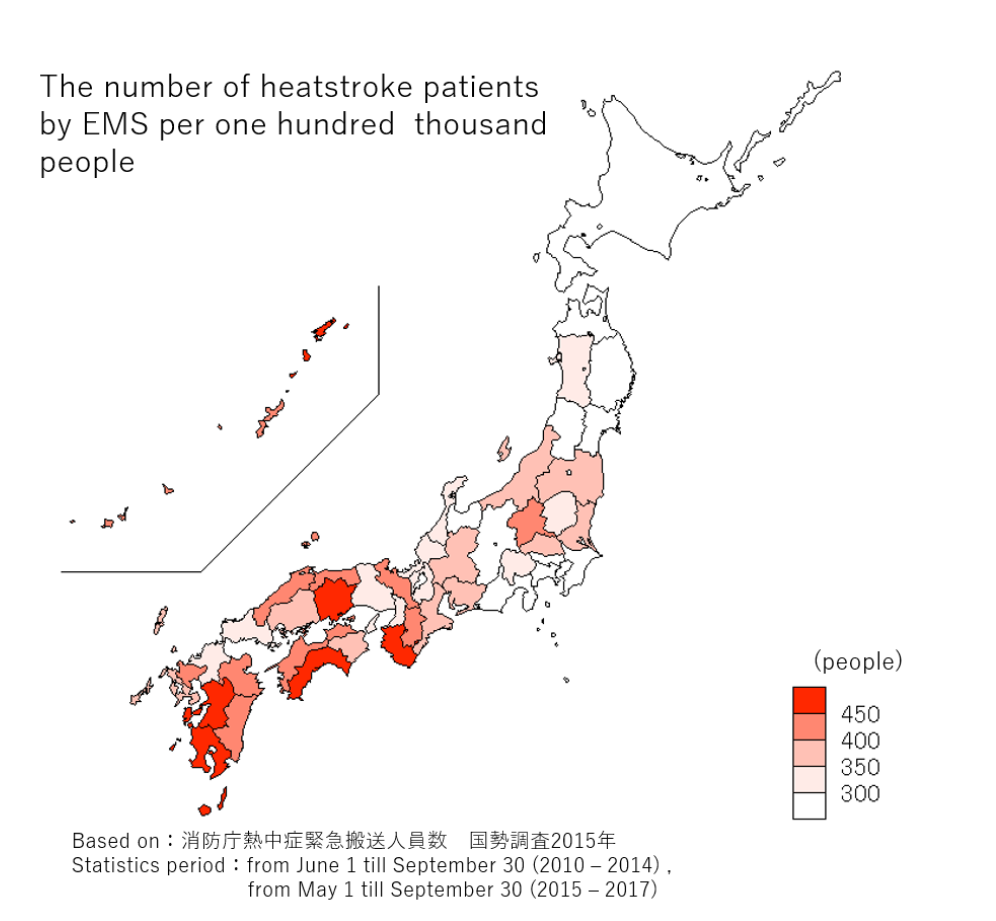
From this map, in western Japan, there are more than 450 heatstroke patients by EMS per 100,000 population, and the rate is high. The worst five prefectures for the number of heatstroke patients by EMS per 100,000 population are Okayama, Wakayama, Kochi, Kagoshima, and Kumamoto.
On the other hand, looking at the prefectures with a large population such as Tokyo, Kanagawa, Osaka, Aichi, Saitama, although the rate of heatstroke patients by EMS is lower than that of other prefectures, the number itselfshould not be neglected.
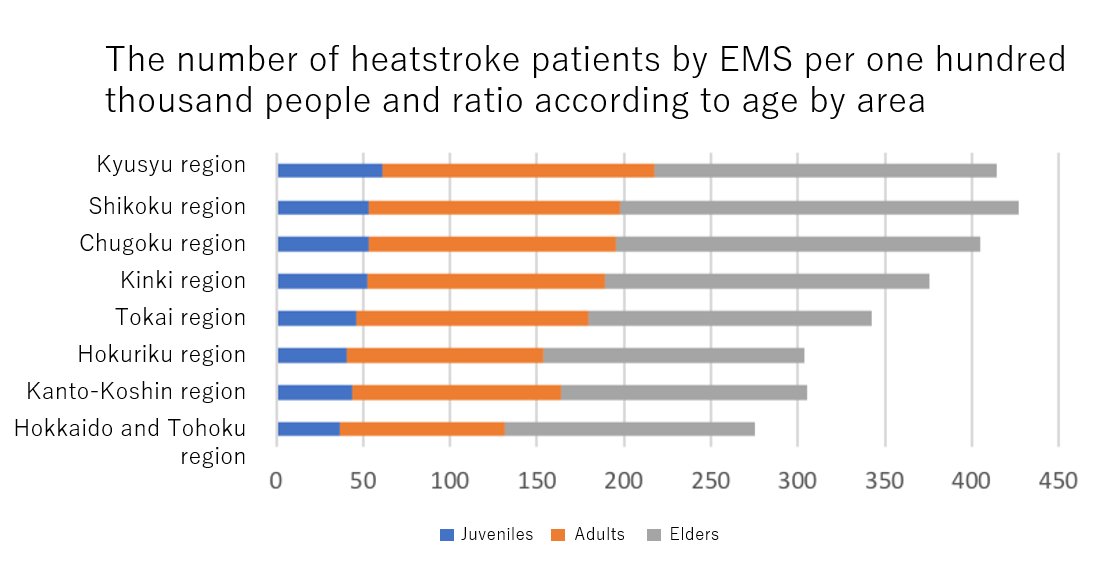
As the graph shows, there are a large number of heatstroke patients by EMS per 100,000 population. The top three are Shikoku, Kyushu and Chugoku. In addition, in Hokkaido and Tohoku region where people may think that those regions have more comfortable summer than in western Japan, there are not a few patients there. The number is not small.
Next, we will focus on the characteristics of climate by region and examine its relevance to heatstroke. The following four maps summarize the data of each prefecture in the past eight years.
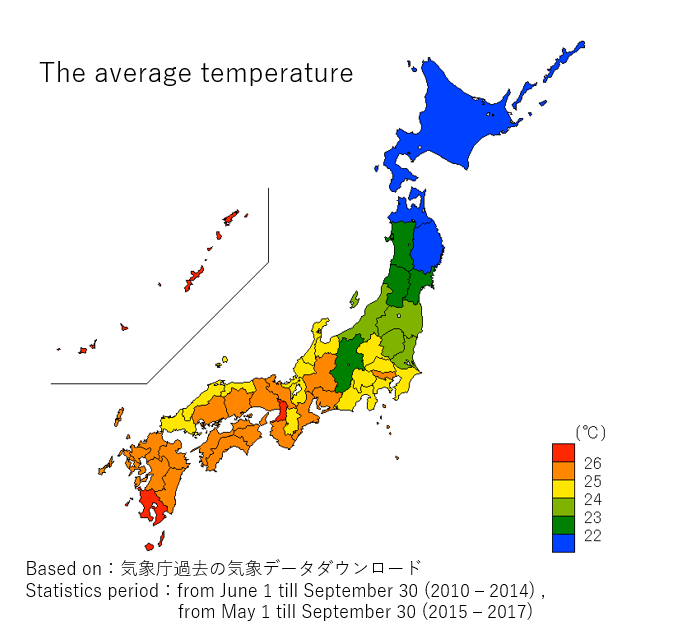
First, the average temperature per day from June/May to September is shown in the map. The average temperature in western Japan is higher than that in eastern Japan. The prefectures with high average temperatures usually have a large number of heatstroke patients by EMS.
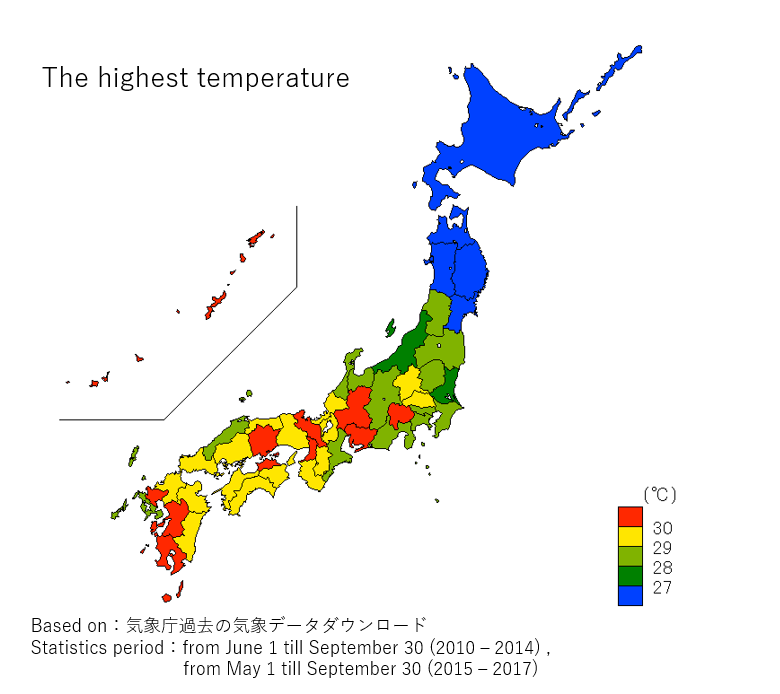
The average of the highest temperature per day from June/May to September is shown in the map above. Similar to the comparison of average temperature, the highest temperature in western Japan is higher than that in eastern Japan.
On the other hand, the degree distribution of highest temperature is greater than the average temperature. Moreover, basin areas, such as Kyoto and Okayama tend to have the highest temperature.
Among the worst five prefectures with a large number of heatstroke patients by EMS per 100,000 population, Okayama, Kagoshima, and Kumamoto prefecture have the highest temperature of 30 degrees celsius or more.The prefectures with high temperatures in western Japan tend to share a large number of heatstroke patients per 100,000 population.
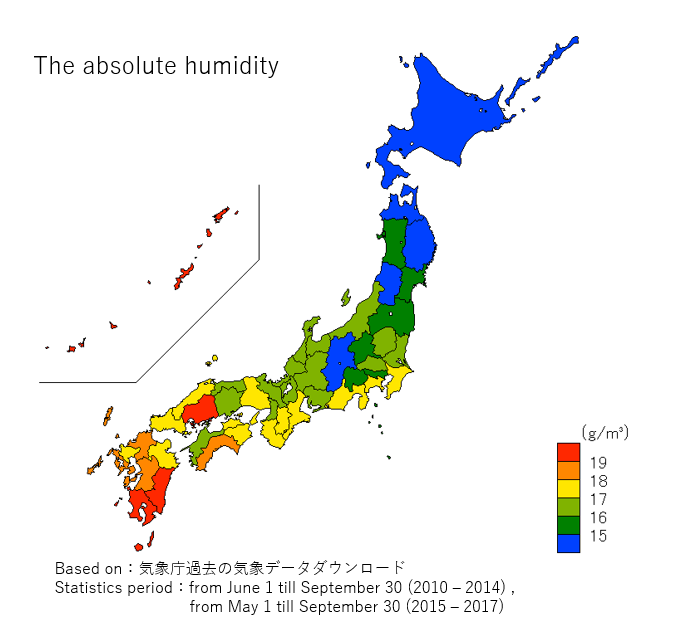
We also compared the absolute humidity. Absolute humidity means the amount of water vapor per 1m³. The average value of absolute humidity per day from June/May to September is relatively higher in western Japan. Other areas of high absolute humidity are located in the southern Kanto region, which face the Pacific Ocean. From the map above, we found the two important factors. First, the average temperature in summer is higher than 24℃ Celsius. Second, the coastal prefectures with a high amount of precipitation havehigh absolute humidity. The prefectures with high absolute humidity are closely consistent with those with a large number of heatstroke patients by EMS per 100,000 population and they both are located in western Japan, except Okayama prefecture.
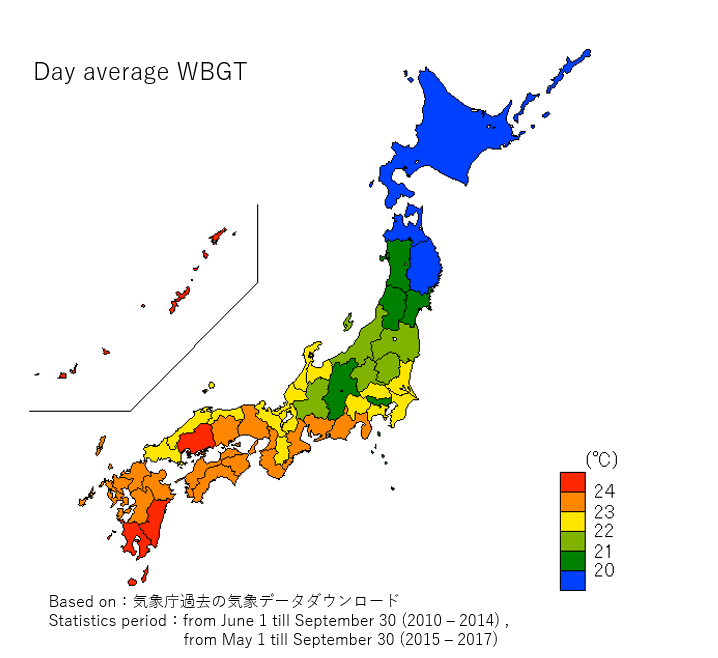
The average value of WBGT (the index showing the risk of heatstroke) from June/May to September is relatively higher in western Japan, and Tokai and the southern Kanto regions are shown in the map. The prefectures with a high day average WBGT and those with a large number of heatstroke patients by EMS per 100,000 population are approximately matched in western Japan.

We used the day average WBGT, not the highest WBGT because t the former uses the calculation based on the weather data disclosed in 47 prefectures, and no wind or global radiation data was available when the highest temperature was recorded. Moreover, because heatstroke does not occur only in the areas with the maximum temperature, we can grasp the tendency by analyzing the day average WBGT.
From the listed maps of average temperature, highest temperature, absolute humidity, and day average WBGT, we conclude that western Japan holds more risk factors of heatstroke and it is natural that the rate of heatstroke patients in western Japan is higher.
Here, we examine which is the most effective indicator. The following chart indicates the correlation coefficient, which means the strength of the relationship, between the number of heatstroke patients by EMS and the four indicators.
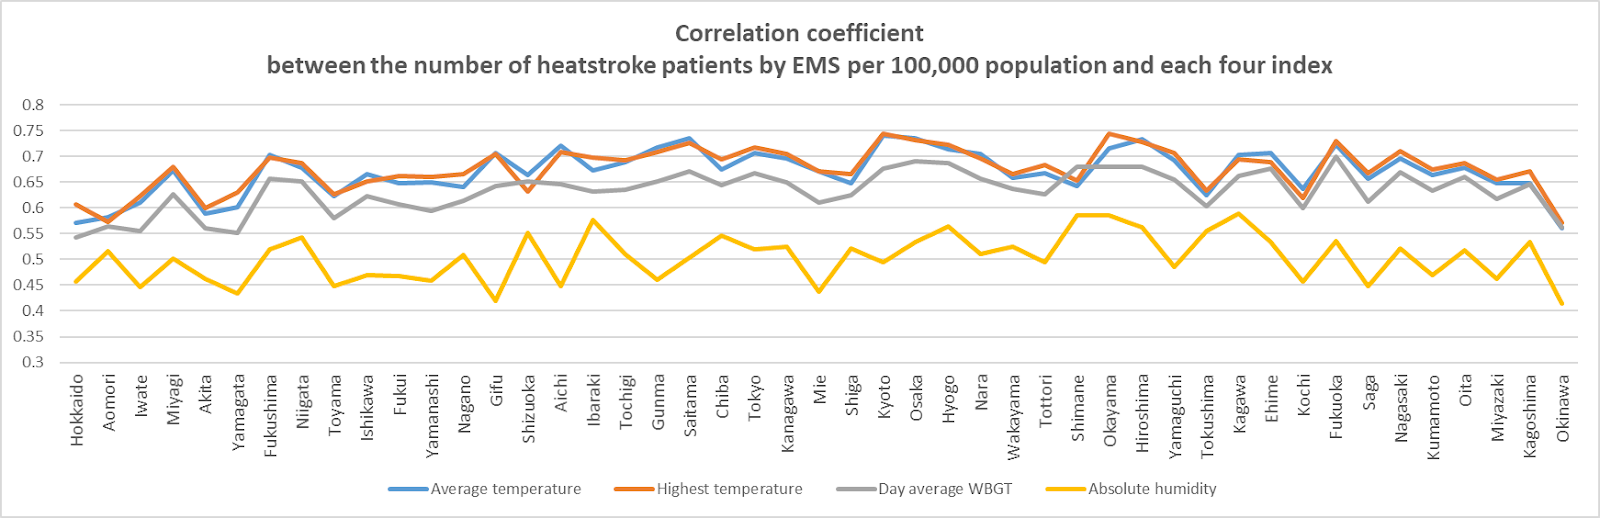
The most effective indicator is temperature. WBGT is slightly less correlated than temperature. Since the difference by prefectures of the correlation between the number of heatstroke patients is the smallest, the WBGT can be analyzed as a nationally adaptable indicator.
In addition, since humidity is greatly related to heatstroke, it has the similar graph motion between the highest temperature and WBGT when examining the absolute humidity. However, the correlation is relatively weak. Therefore, the effect will be increased more by combining the element with the temperature by using the absolute humidity, that is, only the amount of water vapor as an index.
 ・Large metropolitan areas such as Tokyo, Osaka, Aichi, and Fukuoka prefectures tend to have larger numbers of heatstroke patients. In such areas, the heat island phenomenon is related with the increase of the heatstroke risk.
・The rate of heatstroke patients by EMS is relatively higher in western Japan. In addition, average temperature, highest temperature, daily average WBGT, and absolute humidity of western Japan are tend to be higher as well.
・ Correlation between the indicators and the rate of heatstroke patients by EMS from strong to weak is “temperature” > “WBGT” > “amount of water vapor”. In addition, WBGT is superior as an indicator in that the difference in correlation with its rate by region is small.