Visualize Water Problems around the World (3)
Let's take a look at the considerations about each coutry by using GIS.
Please click items to read considerations.
You can select considerations on the side menu.
We selected 9 coutries that had all data.
United States of America
We selected United States of America because in U.S water stress is occurring even though renewable water resources per capita is large.
Mexico
We selected Mexico because in Mexico renewable water resources per capita is unevenly distributed and population not using safely managed drinking-water services.
Brazil
We selected Brazil because Brazil becomes a country where agriculture is thriving. Also agriculture is the backbone of this country’s economy.
Singapore
We selected Brazil because Brazil becomes a country where agriculture is thriving. Also agriculture is the backbone of this country’s economy.
India
We selected India because in India water problems arise even though there is a lot of water resources.
Saudi Arabia
We selected Saudi Arabia because in Saudi Arabia water problems arise even though renewable water resources per capita is small.
France
We selected France because France imports a lot of virtual water even though the food self-sufficiency is high.
Italy
We selected Italy because Italy imports a lot of virtual water.
Republic of Congo
We selected Republic of Congo because in Republic of Congo people cannot use safely managed drinking-water services even though renewable water resource per capita is large.
United States of America
United States of America Suffering from Local Water Scaricity

Map 1

Map 2

Map 3

Climate of United States of America
The climate of United States greatly differs between the eastern side and western side with the vicinity of longitude 100 degrees. In the eastern side, the total annual precipitation exceeds 500 mm. However, on the western side is the arid area and the total annual precipitation is less than 500 mm.
For instance, New York, the American East Coast, belongs to humid subtropical climate. There are a lot of rain and the annual precipitation is 1145.4 mm (*1). On the other hand, Winnemucca, Nevada State, the western side, belongs to desert climate. There is almost no rain and the annual precipitation is 212.1 mm (*1).
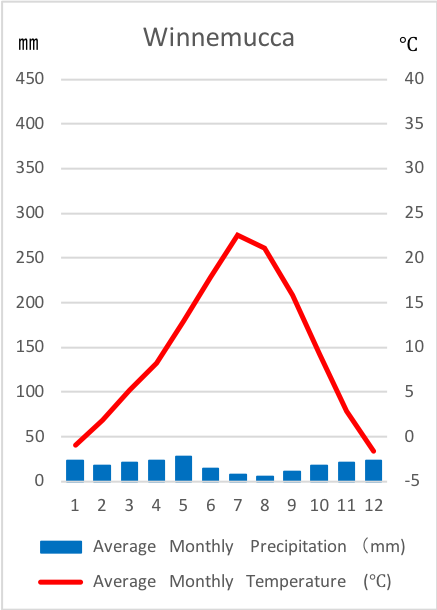
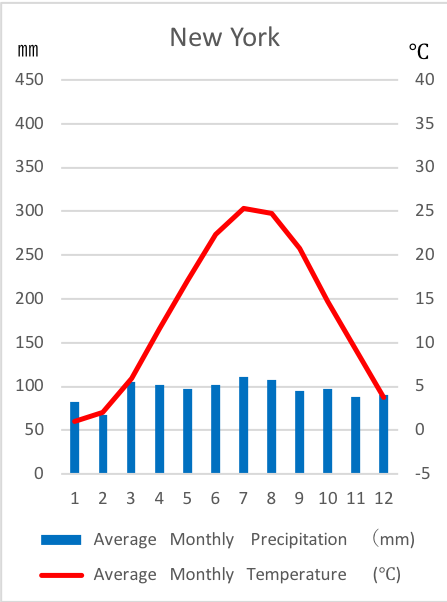
The original graph made on the basis of the data (*1) from Japan Meteorological Agency
Renewable water resources per capita of whole country of United States of America is 9538 ㎥/inhab/yr (*2). There are abundant water resources and the percentage of water stress (Glossary) is low (Map 1).
Well, is there no water problem in the United States?
The following map shows water stress by areas. It indicates that there is serious water stress in the western part of the United States.
The diving line which separates yellow areas and red areas is where more serious water stress is occurring. It almost matches not only with longitude 100 degrees but also with the dividing line which is the annual precipitation of 500 mm.
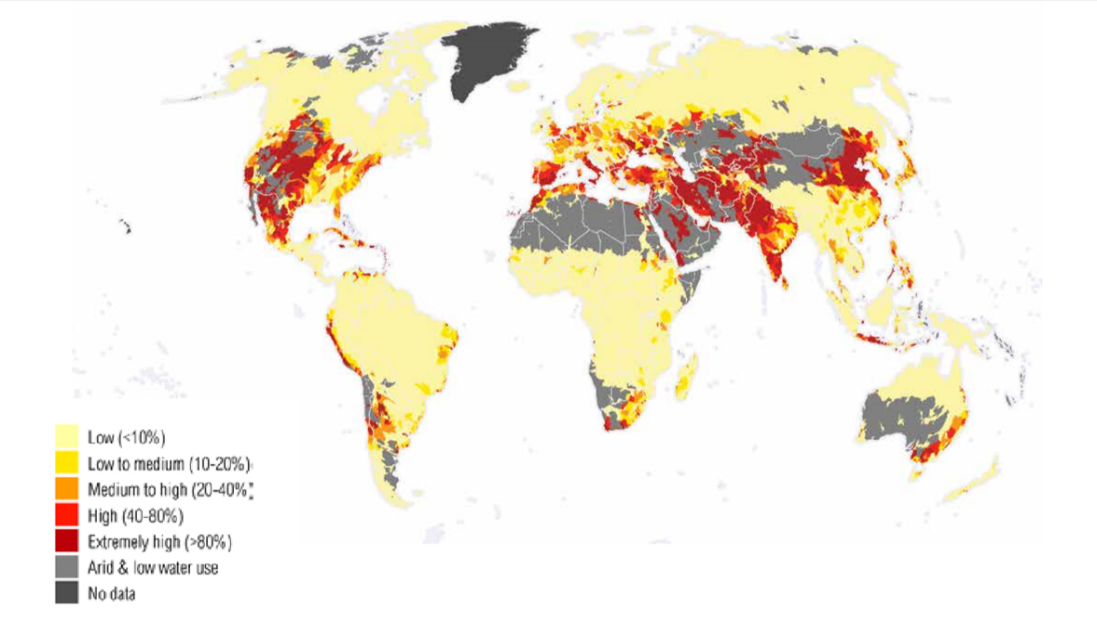
Reference:WRI. (2014). Aqueduct Metadata Document – Aqueduct Global Maps 2.1,data of 1950 – 2010 Retrieved November 6, 2018
Agriculture of United States of America
The arid area in the western areas of the United States with the annual precipitation 500 mm and under is enthusiastic about grazing and mixed agriculture growing wheat and corn.
Farmers conduct large scale irrigated, center pivot irrigation, utilizing sprinklers. It is because there is no enough water for agriculture by precipitation alone.
Water for sprinkling is primarily groundwater, so the quantity of drown water from underground is 485.6 billion (*3). The amount is ranked second in the world after India (Map 2).
Recently, due to excessive underground water drawing, a problem that the ground water level of the Ogallala aquifer, the largest underground water layer in the world, is dropping.
The agriculture using center pivot irrigation has a benefit of being able to conduct large scale agriculture with a little hand. It is an efficient way of agriculture. However, there is also a disadvantage that is taking water more than necessary from underground.
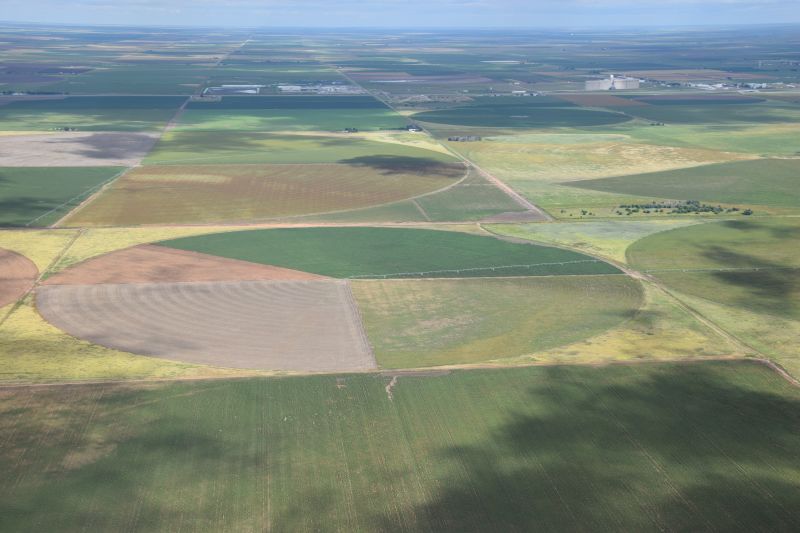
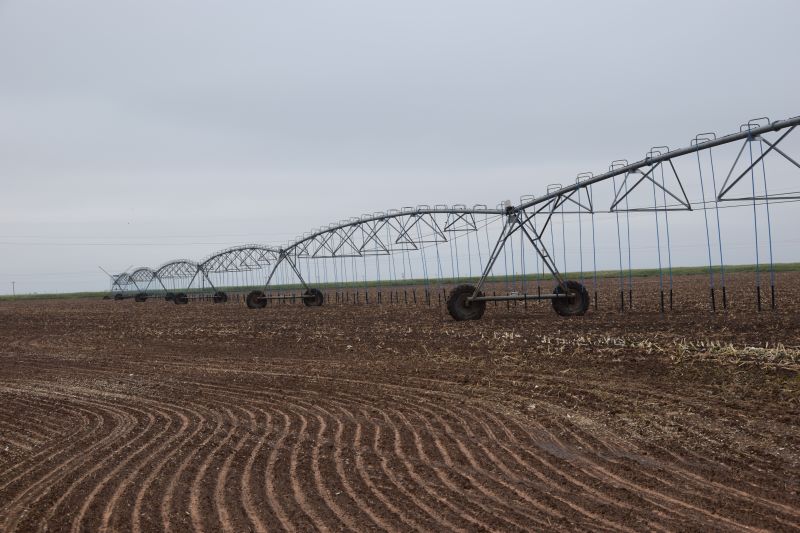
Photo by Teikoku shoin
Virtual Water Trade of the United States
Edible meat import value of the United States is 8.43 million dollars/yr (*4). The value is second in the world after Japan. While edible meat export value is 17.57 million dollars/yr (*4) and cereals self-sufficiency rate exceeds 100 %. As you can see from this value and rate, United States of America exports a lot of agricultural and livestock products.
For that reason, arrows that shows export of virtual water from United States of America to other countries are prominent.
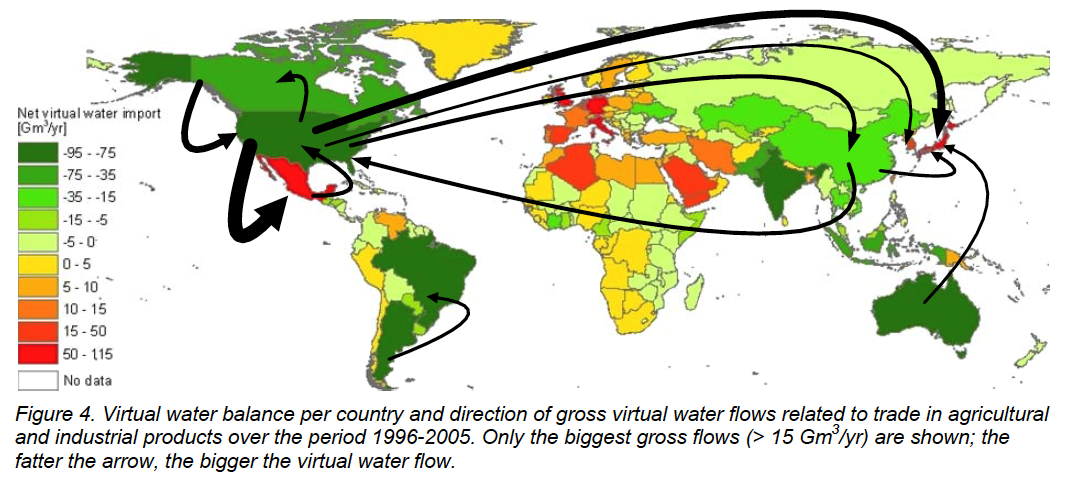
Virtual water trade and the quantity of virtual water import
National Water Footprint Accounts 2011 (data of 1996 - 2005)

In conclusion, United States of America has abundant water resources and the water stress is low. However, people in the western part of the U.S are suffering from serious water scaricity. In addition, the U.S is a country that exports large amount of virtual water with agricultural and livestock products export.
*1:Japan Meteorological Agency. (n.d.).
Sekai no tenkou date tool [Date tool of the world’s climate], Retrieved November 12, 2018
*2:
FAO. (2014). Total internal renewable water resources per capita, Retrieved November 12, 2018
*3:
FAO. (2017) . AQUASTAT Main Database - Food and Agriculture Organization of the United Nations, Retrieved November 12, 2018
*4:
ITC. (2017). Retrieved August 7, 2018
References
Akio, S. (2011). Nihon ha sekaiichi no mizushigenn, mizugijutsu koku [Japan is the world best water resources and water technology]. Tokyo: Koudansya
Mexico
Uneven Distribution of Water Resources

Climate of Mexico
The characteristics of climate of Mexico is ggreat difference of the average annual precipitation between north and south. The average annual precipitation of Mexico is 758 mm (*1). However, the monthly precipitation of Ciudad Constitution, Baha California Peninsula, north-western part of Mexico, is 100 mm at the highest.
On the other hand, Mexico City’s, south-eastern part of Mexico, monthly precipitation is 250 mm at the highest.
In other words, water resources are unevenly distributed in the south-eastern part of Mexico, but population and industry concentrate in the north part of Mexico where has a little water resources.
Therefore, according to the research of Japan Water Forum, the renewable water resources per capita in south-eastern areas of Mexico is 13,556 ㎥/inhab/yr and in north areas is 1,897 ㎥/inhab/yr.
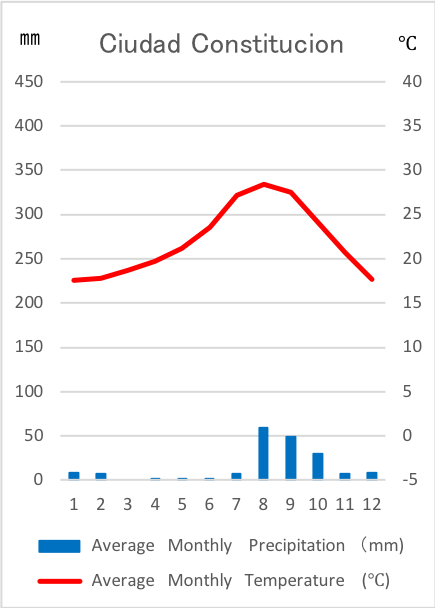
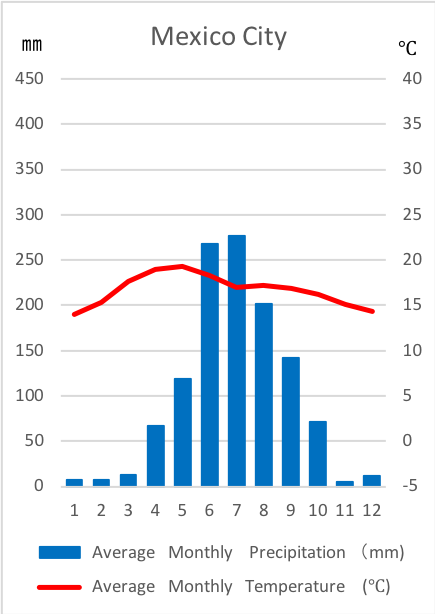
The original graph made on the basis data (*1) from Japan Meteorological Agency
Water Problems in Mexico
Sanitation of Water
In Mexico, the proportion who are not using safely drinking-water services is 57% (*2), more than half of population of Mexico.
The causes of this fact are poor maintenance of infrastructure and aging water pipes. According to the research of Japan Water Forum, 11% people of total population of Mexico, cannot use drinking water and 22% of people cannot use sewage disposal.
Also, water pipes is getting decrepit. Those pipes are easy to be broken when an earthquake or land subsidence happen.
Because they cannot get safe water, many people catch an infection.
Excessive Drawing Underground Water
There are 653 groundwater stratums in Mexico. At December, 2015 in time, 105 out of 635 stratums are considered drawing too much (*3). 39.9% of water used in Mexico is supplied from underground water. In this proportion, 55.2% is drawn from the stratums drawn too much water (*3).
People draw a lot of water from underground stratums especially around Mexico City, the capital of Mexico, damage of land subsidence is occurring.
Also, Mexico is one of the countries which has many irrigation institutions. According to the research of CONAGUA, Comision National Del Agua, 61.2 billion ㎥ water resources is used for agriculture or livestock farming. That quantity accounts for 77% of the water resources supplied per year.
In conclusion, renewable water resources per capita of Mexico is great difference between north and south. Because of poor maintenance of infrastructure and aging water pipes, more than 50% people of total population of Mexico cannot use safely managed drinking-water services.
*1:Japan Meteorological Agency. (n.d.).
Sekai no tenkou date tool [Date tool of the world’s climate], Retrieved November 12, 2018
*2:
WHO. (2015). Total water withdrawal,2 Retrieved November 8, 2018
*3:
CONAGUA (2017). Retrieved November 12, 2018
Reference
BuzzFeed News Retrieved November 8, 2018

Map 1
Brazil
Even if the Average Annual Precipitation was Heavy…

Climate of Brazil
Brazil belongs to the tropical rain forest climate and 12 % (*3) of the forest area in the world is occupied by Brazil.
We understand by the Map 1 that the renewable water resources per capita is many times more than the other countries and the average annual precipitation of Brazil, 1,800 mm (*1) is more than twice as heavy as around the world’s, 814 mm (*1).
The average annual precipitation of São Paulo is 1,619 mm and especially it from December to March is heavy as we can understand by the below hythergraph. Additionally, we can understand that precipitation in Brazil is large by the annual precipitation of Manaus where has many rainforest, 2,324 mm is larger than Sao Paulo and high average amount annual temperature.
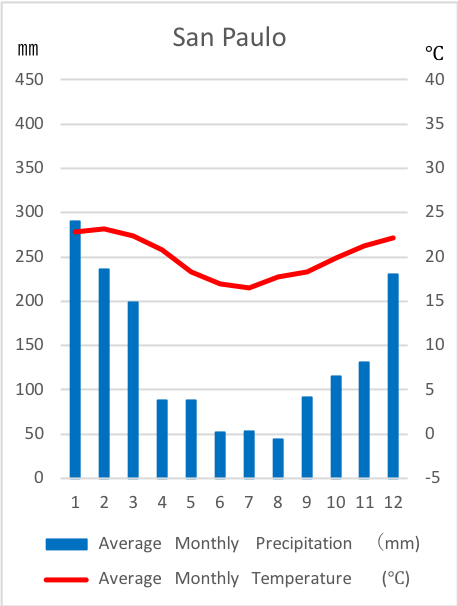
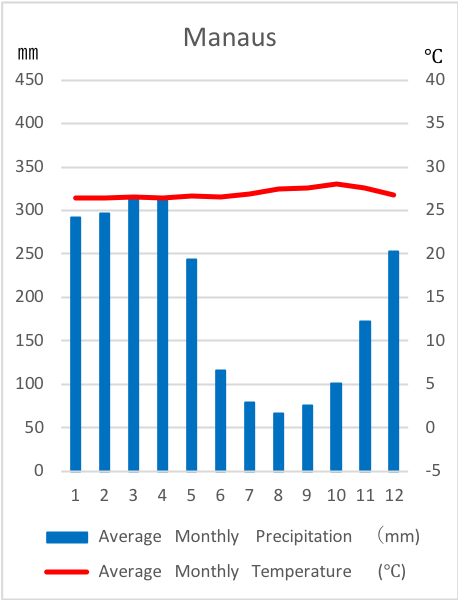
The original graph made on the basis of the data (*2) from Japan Meteorological Agency
However, rainforest is gradually being destroyed. The rainforest in Brazil is decreased from 2010 to 2015 by 0.2 % (*3). If you listen like this, some of you may be surprised.
But as you can see from the figure in right, decrease in area is the largest in the world and decreasing is continuing even now. Because the Large-scale felling is done to develop up a new field and farm.
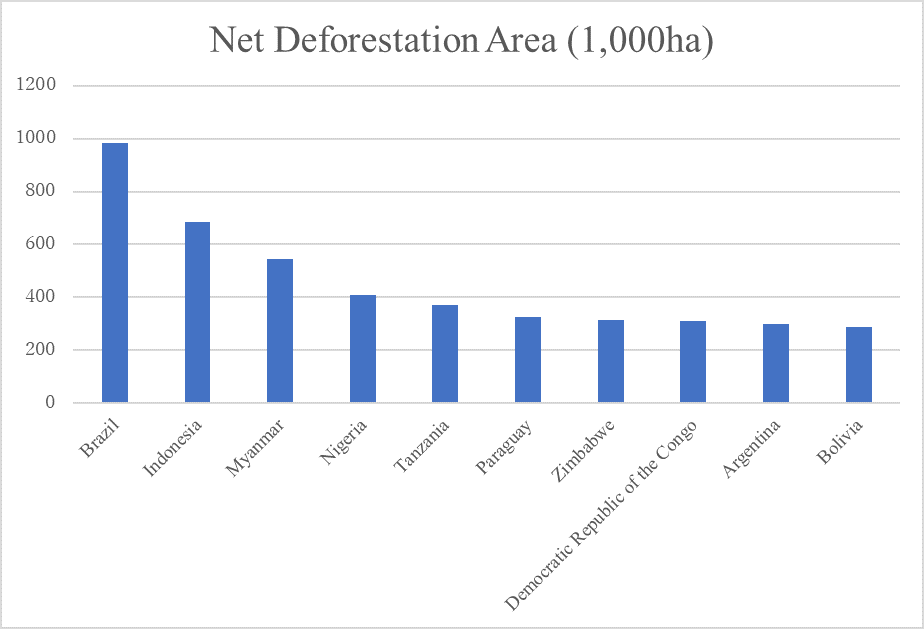
The original graph made on the basis of the data (*3) from Forest Resources Assessment
Agriculture of Brazil
Brazil keeps the cattle the most in the world, (*1) and production volume of beef is the second largest (*4), export volume is the largest (*4) in the world.
Beef need the largest water resources to product in meat. Beef need water nearly 3.5 times as large as pork, nearly 4.5 times as large as chicken.
Also, the exports of coffee bean (*4), corn (*4) and soybean (*1) are the largest in the world. Brazil is active in agricultural products. For that reason, the amount of virtual water in Brazil becomes large.
We can understand agriculture and economy of Brazil is supported by rich water resources.
*1:FAO. (2014). Long-term average annual precipitation in depth, Retrieved November 12, 2018
*2:Japan Meteorological Agency. Average monthly precipitation and monthly temperature, Retrieved November 12, 2018
*3:FRA. Net deforestation area, Retrieved November 12, 2018
*4:FAO. (2013). The number of cattle kept, Production volume of beef, Exporting volume of beef, Retrieved November 12, 2018
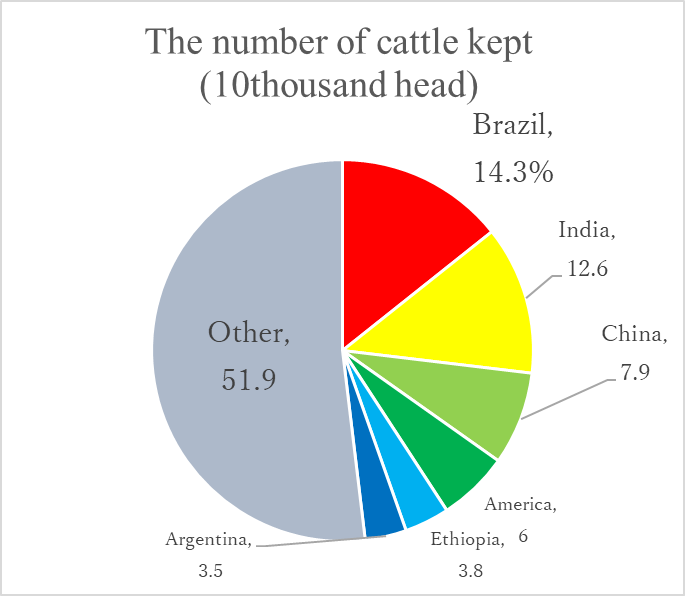
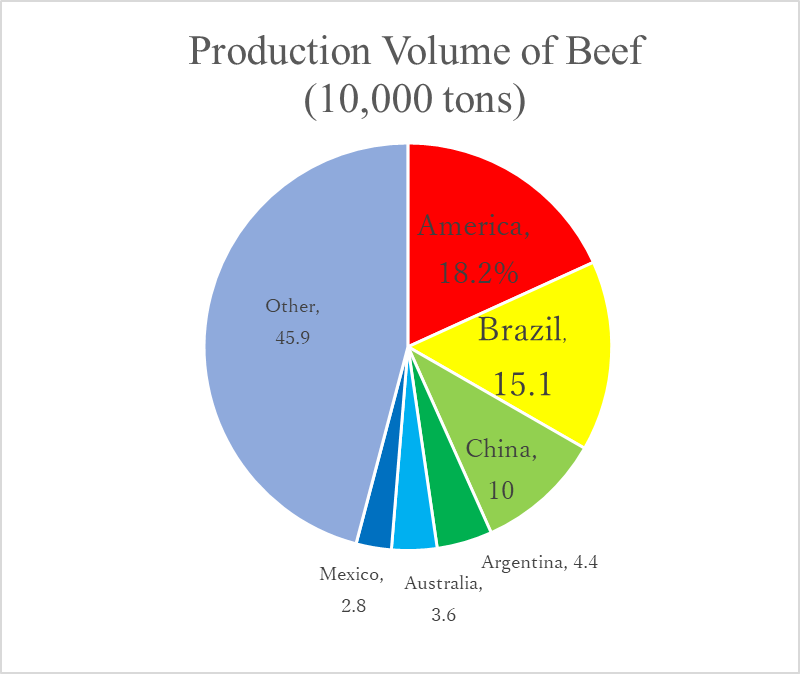
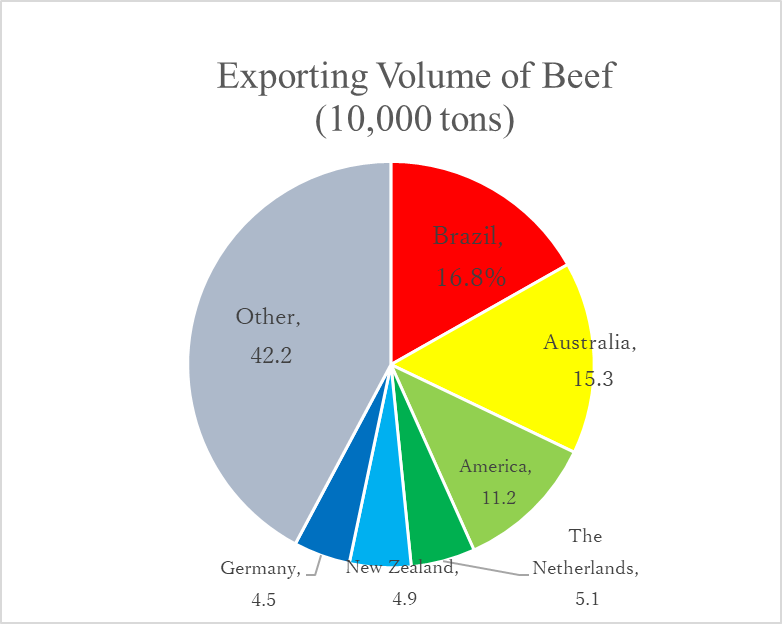
The original graphs made on the basis of the data (*1, 4), from Food and Agriculture Organization of the United Nations

Map 1

Map 2

Map 3
Singapore
Buy Water with Money

The Climate of Singapore
Singapore is an island country to the southeastern of the Malay Peninsula and no larger than 23 wards of Tokyo. Because it is in the tropical zone, and hot and humid throughout the year, the average annual precipitation of Singapore is 2,497mm (*2) and there is a lot of rain, compared to that of the whole world, 814mm (*2).
From these things, Singapore seems to be abundant in water at first glance. However, it actually
runs short of water and renewable water resources per capita is 107 m3 / inhat / yr (*3).

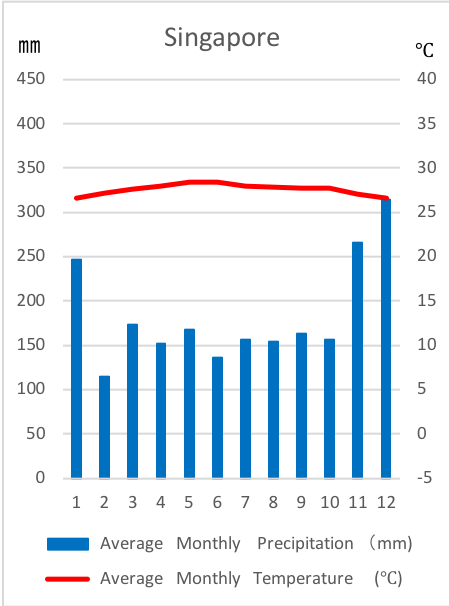
The original graph made on the basis of the data (*1) from Japan Meteorological Agency
Why does Singapore have little renewable water resources per capita even though it rains a lot there?
This is because its capacity to store water is low. Its land is small and level. So it cannot store water easily.
Moreover, many streets in Singapore are paved with asphalt and concrete because it has high economic power, which its GNI is 5,1880 dollars /inhat (*4) and it is a city‐state. This also causes low of water store.
Not having enough big rivers to use as the source of water supply makes it have little available water, though it rains a lot. Meanwhile, the population density is 7,794inhat/km2 ( *5 ), high and the amount of water resources is not enough for the demand. So the quantity of renewable water resources per capita is low.
How does Singapore compensate the lack of water to use there?
Imported Water of Singapore
Singapore secures water resources to import water with high economic power from its neighboring country, Malaysia.
Under the 1962 Water Agreement, Singapore can draw up to 250 million gallons (*6) of water a day from the Johor River.
This is equivalent to about 58% (*6) of water which Singapore needs a day. Imported water from Malaysia now occupies approximately 25% (*6) of total water supply.
But this agreement is effective only until 2061. Furthermore there is sometimes friction about water price between the two countries. Therefore, it is a problem for Singapore to secure water resources by itself as stably as possible.
Virtual Water of Singapore
Because Singapore is so small, it does not have enough farming land and is not agricultural country. The table shows that its proportion of the amount of Agriculture, forestry and fisheries is low compared to Japan’s.
So, it depends on neighboring countries for most of its food. Since Population is small, the amount of food imports is small and the quantity of imported virtual water throughout the country is not large. But it is assumed that the quantity of virtual water imports per capita is large.
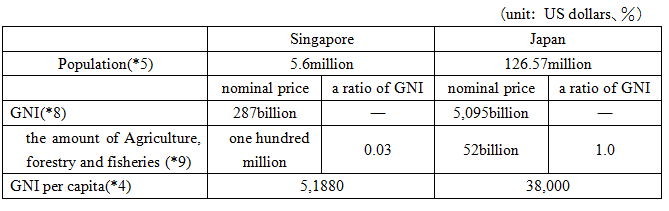
The original table made on the basis of the data (*4, 5, 8, 9) from each institutions
It is possible to compensate the lack of water with economic power even though available water resources are limited, like Singapore.
However, depending on other countries for water resources has a risk to have a water shortage in an emergency.
So, Singapore has three efforts to secure new water resources now.
Three efforts
Water from Local Catchment
In Singapore, which is level, rain that falls on two-thirds (*6) of Singapore’s land area is channeled to 17 reservoirs through a network of rivers, canals and drains. The water from local catchment occupies about 10% (*6) of total water supply.
NEWater
In Singapore, the project to treat and recycle sewage has been driven and is realized on February 2003.
Treated used water is treated again and recycled into ultra-clean, high-grade reclaimed water which we can drink. It was named “NEWater”.
The study was started about NEWater and it was announced that NEWater met the standards of drinking water established by World Health Organization. Today, there are five NEWater plants supplying up to 40% (*6) of Singapore's current water needs.
Desalinated Water
In the desalination plants, salt water in the ocean is changed into fresh water with three-step treatment and supplied. In September 2005, a desalination plant started an operation for the first time in Singapore.
Desalinated water occupies 25% (*6) of total water supply now and is expected to meet up to 30% (*6) of Singapore’s future water needs by 2060.
*1:Japan Meteorological Agency. (n.d.).
Sekai no tenkou date tool [Date tool of the world’s climate], Retrieved November 12, 2018
*2:FAO. (2014). Long-term average annual precipitation in depth, Retrieved November 12, 2018
*3:FAO. (2014). Total internal renewable water resources per capita, Retrieved November 12, 2018
*4:Teikoku shoin. (2016)
*5:FAO. (2015) Total population, Population density, Retrieved November 12, 2018
*6:PUB(Public Utilities Board. (n.d.). Water Supply, Retrieved October 29, 2018
*7:Teikoku shoin (2011)
*8:UN. (2016). GNI at current prices - US dollars, Retrieved October 29, 2018
*9:Ministry of Agriculture, Forestry and Fisheries calculated on the basis of the data by UN
India
Despite Having Much Water, Is Not Possible to Use Water?

The Climate of India
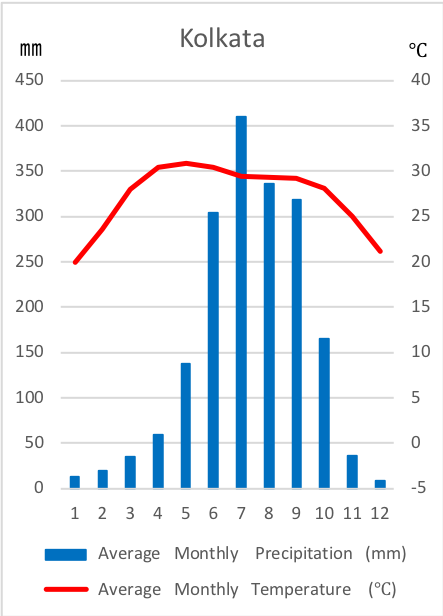
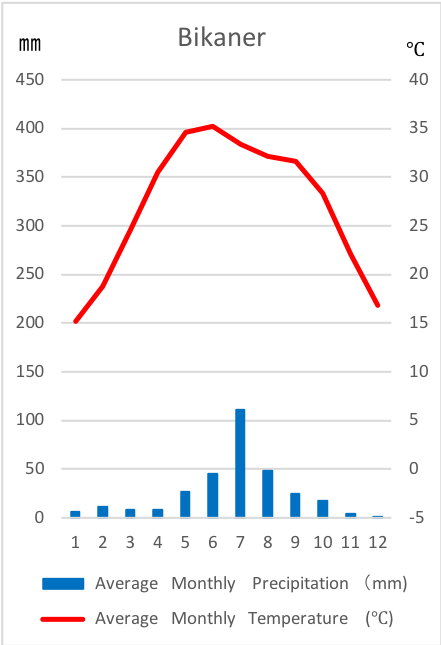
India lies in the South Asia and is the seventh largest country in terms of land area. Whereas it rains a lot and is 1,841mm (*1) in Kolkata, a city in eastern India which is tropical climate, there is little rain and the average annual precipitation is 310mm (*1) in Bikaner, a city in northwest part which is desert and steppe climate.
As I have explained, climate of India varies from city to city.It also has three seasons in a year. They are the monsoon, the dry season and the hot season. So, its climate also differs widely from season to season. The average annual precipitation of India as a whole is 768 (*2) mm. (Map 1) Renewable water resources per capita is 1,458 m3 / inhat / yr (*3) and it is not low compared to the that of Japan which has abundant water, 3,397m3 / inhat / yr (*3). (Map 1)
The original graph made on the basis of the data (*1) from Japan Meteorological Agency
Well, is there no water problem in India?
Irrigated Agriculture in India
Map 1 shows that many people cannot use safely managed drinking-water services. This is caused by excessive pumping up of underground water like that of Western America.
Approximately 45% (*4) of its land is used for irrigation. The northwestern part is desert and steppe climate where it does not rains much throughout the year. So, only rainwater is not enough for agriculture there and many places are irrigated. 23 million well dug deep into the ground pump up underground water from aquifers 24 hours a day.
Map 2 also shows that a great amount of underground water is pulled up. Because water pulled up is much more than that is supplied by rain in India, the groundwater level is decreasing year by year.
According to Centre for Science and Environment, major 21 cities in India will have confronted the situation that the groundwater dries up by 2020.
In India, the rate of the people who cannot use safely managed drinking-water services is 51% (*5) and serious water pollution is the problem.
The sewerage system coverage rate is 15% (*6) and sanitary facilities do not spread well mainly in rural area, so only 20% (*6) of sewage is treated before it is drained and it contaminates rivers and lakes.
Water pollution by agricultural chemicals is also the problem. In 2003, Centre for Science and Environment showed evidence that carbonated drinks manufactured and sold throughout India included high-concentration chemical residue.
According to Centre for Science and Environment, because of these insufficient water supply and contaminated water, 200 thousand people on average die every year. Three-quarters of total population is influenced and 20% of diseases in the country is caused by contaminated water.
Water Crisis
India build Farakka weir near the national border between Bangladesh in 1975. Since India closed it and draw much water from the Ganges River for the internal use during the dry season, Bangladesh which need water as well as India cannot get enough water.
Meanwhile, in the monsoon, it is opened and much water flows into Bangladesh. So, the Ganges River overflows and Bangladesh is affected by flood damages. Because the upper stream flows in India, which is more powerful than Bangladesh, it forced to be in this situation.
Until 1975, these two countries have been fighting over water concession of the Ganges River. The agreements about water concession was reached in 1975 , 77~84. However, today, they have no agreement and Bangladesh insists that it suffers great losses due to India taking water one-sidedly.
Unlike UN’s goal to mediate disputes among member countries peacefully and Bangladesh’s policy to resolve the problem by appealing to the international laws to give countries in the lower river basins the water concession, India insists that the problem should be solved by only bilateral talks. So, this fight hasn’t solved yet.
Countries where water resources are enough but available water is insufficient because of the lack of sanitary facilities and human activities like India exist.
*1:Japan Meteorological Agency. (n.d.).
Sekai no tenkou date tool [Date tool of the world’s climate],Retrieved November 12, 2018
*2: Ministry of Internal Affairs and Communications. (2018).
Sekai no toukei [The statistic of the world 2018], Retrieved November 12, 2018
*3:FAO. (2014). Total internal renewable water resources per capita, Retrieved November 12, 2018
*4: FAO. (2013). % of the cultivated area equipped for irrigation Retrieved November 12, 2018
*5:WHO. (2015). Indicator Metadata Registry, Retrieved December 15, 2018
*6:Black,M .King.J. (2010) . The atlas of water (Oki. T & Oki. A, Trans.) .Tokyo: Maruzen (original work published 2009)
References
・Black,M .King.J. (2010) . The atlas of water (Oki. T & Oki. A, Trans.) .Tokyo: Maruzen ( original work published 2009 )
・Barlow, M. (2008) . Water business (Sakuma. T, Trans.).Tokyo: Sakuhin Sya (original work published)
Saudi Arabia
Crude Oil is Their Life!

Climate of Saudi Arabia
Saudi Arabia has Nehud Desert in north, Rub Al Harri Desert in south. Most of the land belongs to desert climate of drying zone. For this reason, water stress is high, 1243 % (*1) and renewable water resources per capita is minute overwhelmingly, 76.09 ㎥ (*2) (Map 1).
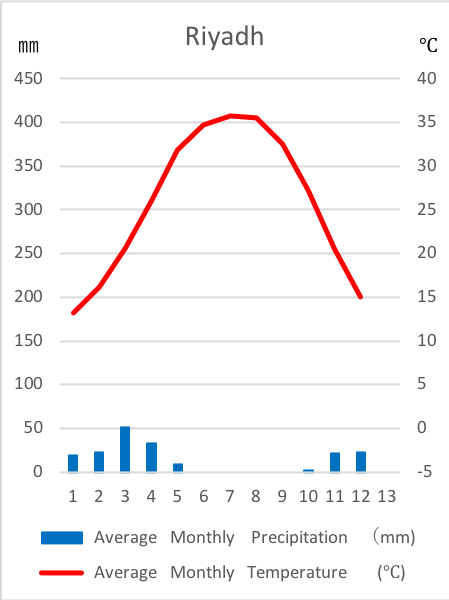
TThe original graph made on the basis of the data (*3) from Japan Meteorological Agency
The agriculture of Saudi Arabia
Saudi Arabia is securing water resources by pumping up underground water and flourishes with date palm. Saudi Arabia was used to be active in wheat cultivation and they accomplished self-sufficiency in 1980s. However, the depletion of the groundwater was occurred simultaneously, so they stop wheat cultivation by 2016.
Saudi Arabia has a difficulty to do agriculture because most of the country is desert, so they rely on imports for 80 % of the food demand (*4). Due to this circumstance, the quantity of virtual water imports is increasing. They can import tremendous food, because economy of Saudi Arabia is abundant.
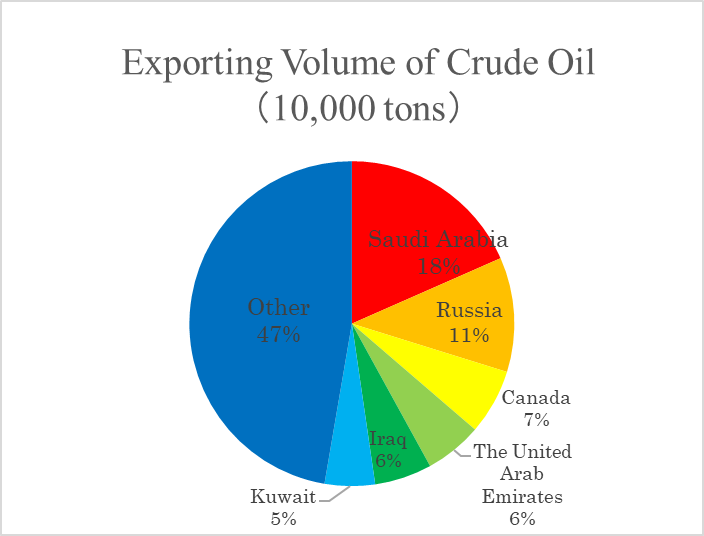
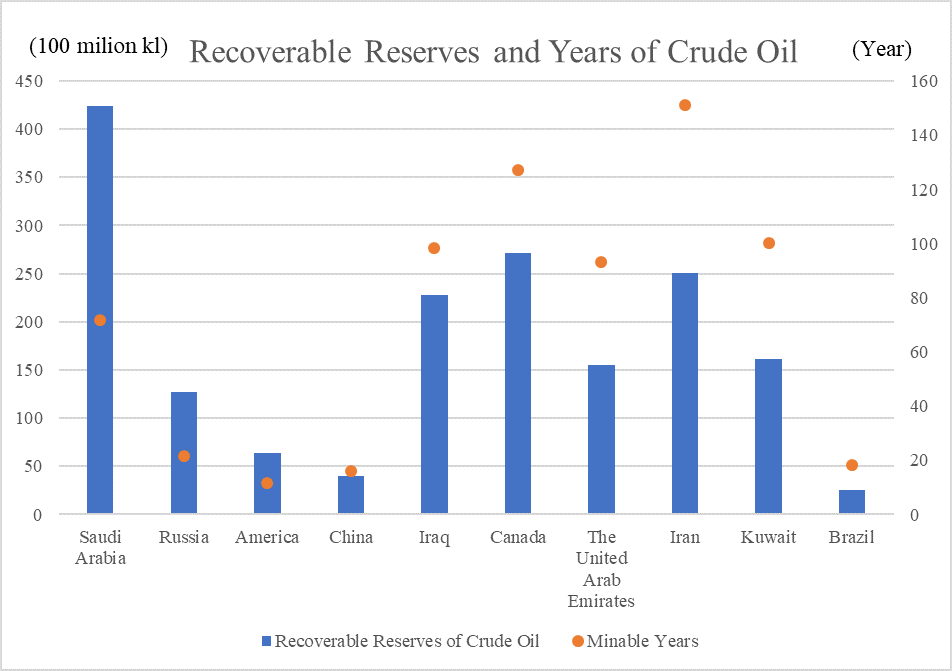
The economic is supported by crude oil.
However, we can learn by the graph above that against the available amount of crude oil is much, 43.29 billion KL, available years is shorter than Iraq and Canada, 71.9 years. Concerning about this situation, the word “de-oil dependence” is advocated, but still they can’t get out.
They make use of their rich finances and secure water by using technology of seawater desalination in recent years, too.
Saudi Arabia make their economy rich by exporting crude oil and secure food and water resources.
*1:FAO. (2018). Water stress, Retrieved November 12, 2018
*2:FAO. (2014). Renewable water resources per capita, Retrieved November 12, 2018
*3:Japan Meteorological Agency. Average monthly precipitation and monthly temperature, Retrieved November 12, 2018
*4:Ministry of agriculture. “circumstances of agriculture and forestry and fisheries in Saudi Arabia”Retrieved November 12, 2018
*5:The data of “World National Council” 2016/2017 version
The original graph made on the basis of the data (*5) from “World National Council” 2016/2017 version
The original graph made on the basis of the data (*5) from “World National Council” 2016/2017 version

Map 1

Map 2

Map 3
France
They Import Even if Their Country is Active in Agriculture!

The Climate of France
Summer in France is comparatively cool due to the prevailing westerlies and warm current. And marine west coast climate makes there warm in winter. The day that highest temperature exceeds 30℃ is rare.
Precipitation is almost same through the year and the average annual precipitation is highly ordinary, 867 mm (*1). Renewable water resources per capita is 3,277 ㎥/inhab/yr (*2), it is not especially large (Map 1).
Such cool and comfortable climate greatly relates to the agriculture in France.
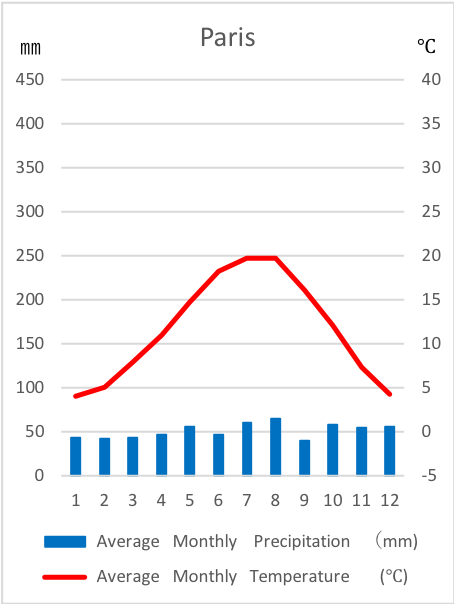
The original graph made on the basis of the data (*3) from Japan Meteorological Agency
The agriculture in France
The agriculture in France is very active in Europe.
What is mixed farming?
France is active in mixed farming. Mostly, mixed farming is introduced in a landlocked country in Europe.
They grow barley and oats in summer, wheat and rye in winter. Additionally they grow forage crop for example corn and grass, then give them cattle and grow at the same time. It has the advantage of being able to use livestock waste as fertilizer, too.
Further there are lots of case that mixed farming develops into the farming expert of wheat. In fact, France is the fifth largest wheat production (*4) and the second largest per 1ha crop yield (*2).
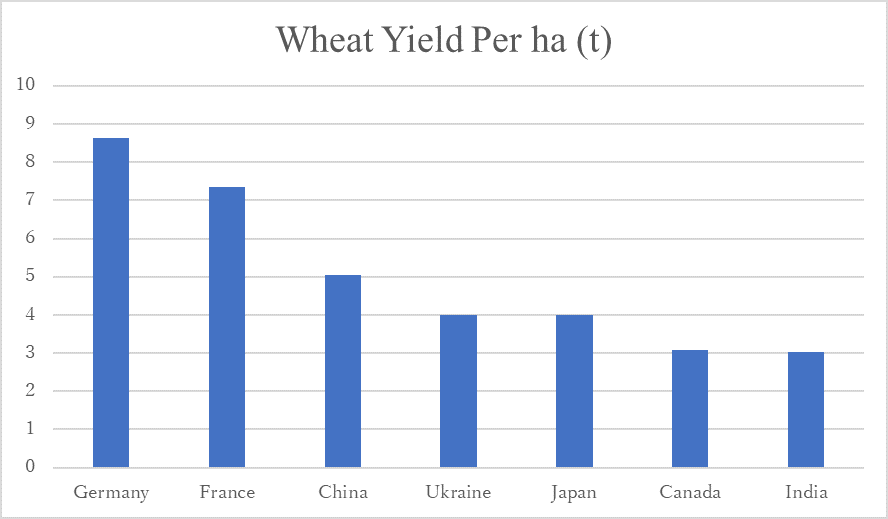
The original graph made on the basis of the data (*2) from Food and Agriculture Organization of the United Nations
Also, France is the largest wine production (*4) in the world.
The main reason for it is the average annual temperature of France (10-20℃) is feasible for growing grapes.
The grain self-sufficiency rate in France is 176 % (*5), it is high and further mixed farming is organized. So, we tend to think that France can proved their food easily, but import side stand out simultaneously, for instance France is the third largest importing oranges and fifth largest importing cacao in the world.
We must depend on import food that does not grow in home country, so the quantity of virtual water imports exceeds the total export volume.
As France, countries which the quantity of virtual water imports is high are exist even if there are active in agriculture.
*1:FAO. (2014). Long-term average annual precipitation in depth, Retrieved November 12, 2018
*2:FAO. (2014). Per 1ha crop yield, Retrieved November 12, 2018
*3:Japan Meteorological Agency. Average monthly precipitation and monthly temperature, Retrieved November 12, 2018
*4:FAO. (2013). Wheat production, Wine production, Retrieved November 12, 2018
*5:Shinshou koutou chizu. [Teikoku's Atlas] (2017). Teikoku shoin
Italy
How to Make Use of Climate?

Climate of Italy
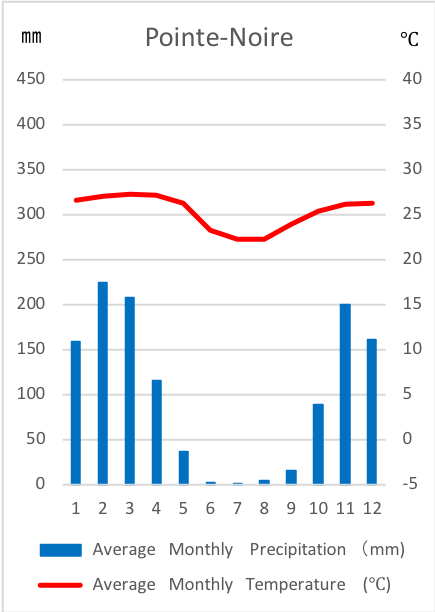
Italy is Mediterranean climate and the temperature is high and drying in summer. The precipitation become large because of the prevailing westerlies and extratropical cyclone in winter. The average annual precipitation is 832 mm (*1), renewable water resources per capita is 3,199 ㎥/inhab/yr (*2). It is a modest differential nicety, but we can know that France has more water resources than Italy (Map 1).
However, Italy has large total water consumption (life・agriculture・industry ) in Europe and also water stress is 45 % (*4) (Map 1).
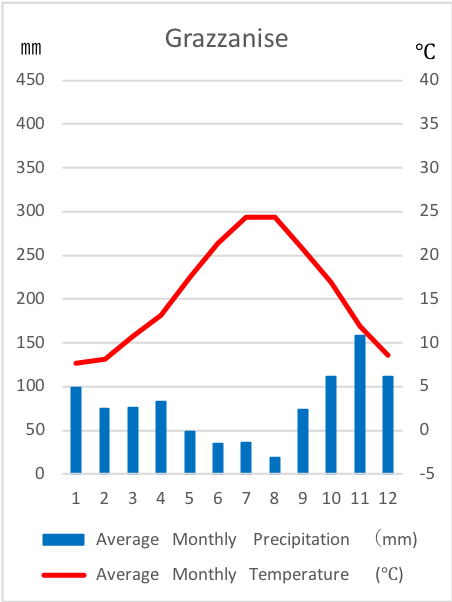
The original graph made on the basis of the data (*3) from Japan Meteorological Agency
Agriculture of Italy
Italy do Mediterranean agriculture. Mediterranean agriculture is the way of cultivation growing wheat in the flatland, growing grapes and oranges, and olives in the highland.
These are strong in drying, and these were developed because we can product these in extremely drying summer. Wine production is the second largest (*5), and olive production is the third largest (*2) in the world.
The rate of the area where are doing agriculture is 45 % (*6) because they desterilize on the slope of the mountain instead of flatland.
But, the grain self-sufficiency, 76 % (*7) is low and this is the present.
The original graph on the basis of the data of Ministry of agriculture “circumstances of agriculture and forestry and fisheries in Italy”.
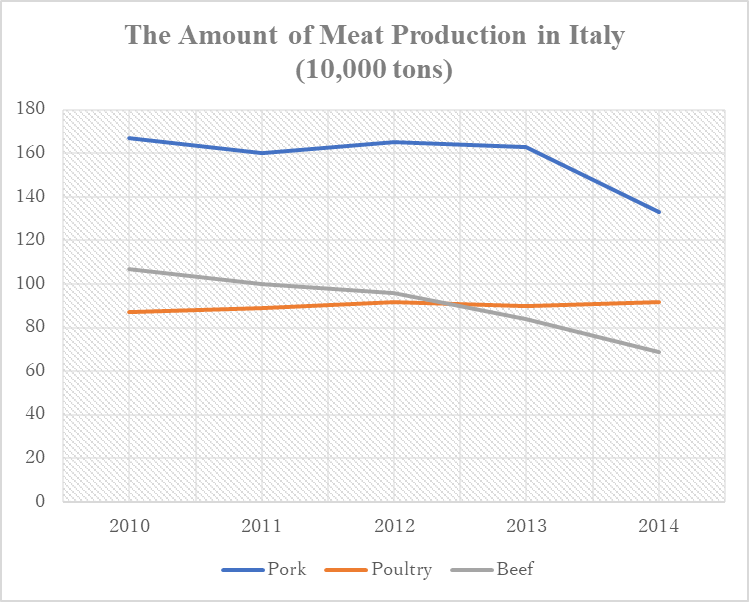
Also, as we can see from the figure in right, meat production especially pork and beef are decreasing recent years. Against beef production decreasing, Italy is the fifth largest beef export (*5) in the world.
Meat need a large amount of virtual water, so the more try compensating by importing, the quantity of imported virtual water increase simultaneously.
Also, Italy is the second largest tea import (*5) and the third largest coffee bean import (*5) in the world.
Italy has a task how to make use of blessed climate and increase the grain self-sufficiency rate.
*1:FAO. (2014). Long-term average annual precipitation in depth, Retrieved November 12, 2018
*2: FAO. (2014). Renewable water resources per capita, Olive production, Retrieved November 12, 2018
*3:Japan Meteorological Agency. Average monthly precipitation and monthly temperature, Retrieved November 12, 2018
*4:FAO. (2018). Water stress, Retrieved November 12, 2018
*5:FAO. (2013). Wine production, Beef export, Tea export, Coffee bean export, Retrieved November 12, 2018
*6:Ministry of agriculture. “circumstances of agriculture and forestry and fisheries in Italy”, Retrieved November 12, 2018
*7:Shinshou koutou chizu. [Teikoku's Atlas] (2017). Teikoku shoin

Map 1

Map 2
Republic of Congo
Even Though There Are Abundant Water Resources...

Climate of Republic of Congo
Republic of Congo belongs to central Africa. Most of Congo’s land is Savanna Climate. The rainy season and dry season are clearly divided.
Renewable water resources per capita in Republic of Congo is abundantly 180,087 ㎥/inhab/yr (*1). It because the country has a lot of rain. The Congo River which the size of a river basin is 3,700,000㎢ (*2) and the length is 4,667m (*2) is on the border with Republic of Congo and Democratic Republic of Congo.
Also, the population density is 14 inhab/㎢ (*3). The figure is lower than world average. small water resources is one of the reasons for large amount of renewable water resources per capita.
The original graph made on the basis of the data (*4) from Japan Meteorological Agency
On the other hand, the population do not use safely managed drinking-water services is 32% in the whole country, 15% in urban areas and 63% (*5) in rural areas.
Also, the total literacy rate is 20.7%, one out of five people cannot read and write. BBy gender, illiteracy rate for boys is 13.6%, and 27.1% for girls (*6). It shows that girls’ illiteracy rate is higher than boys.
It is because women and girls in the most developing countries have to pump out and carry water from river to their houses, and they cannot go to school or work (Map 2).
If infrastructure is not in places, people cannot get safe water no mutter how much water resources they have.
There are connections between not only natural condition but also infrastructure.
*1:FAO. (2014).Total renewable water resources per capita,Retrieved November 12, 2018
*2:Science Chronology (2014)
*3:UN. (2017). Demographic Yearbook 2017, Retrieved January 8, 2019
*4:Japan Meteorological Agency. (n.d.).
Sekai no tenkou date tool [Date tool of the world’s climate], Retrieved November 12, 2018
*5:WHO. (2015). Population using safely managed drinking-water services,Retrieved November 12, 2018
*6:UNESCO.(2014). Literacy rate, Retrieved November 12, 2018